Misc
Explainer: Earth’s Tectonic Plates
Article/Editing:
Click to view a larger version of the graphic.
Explainer: Earth’s Tectonic Plates
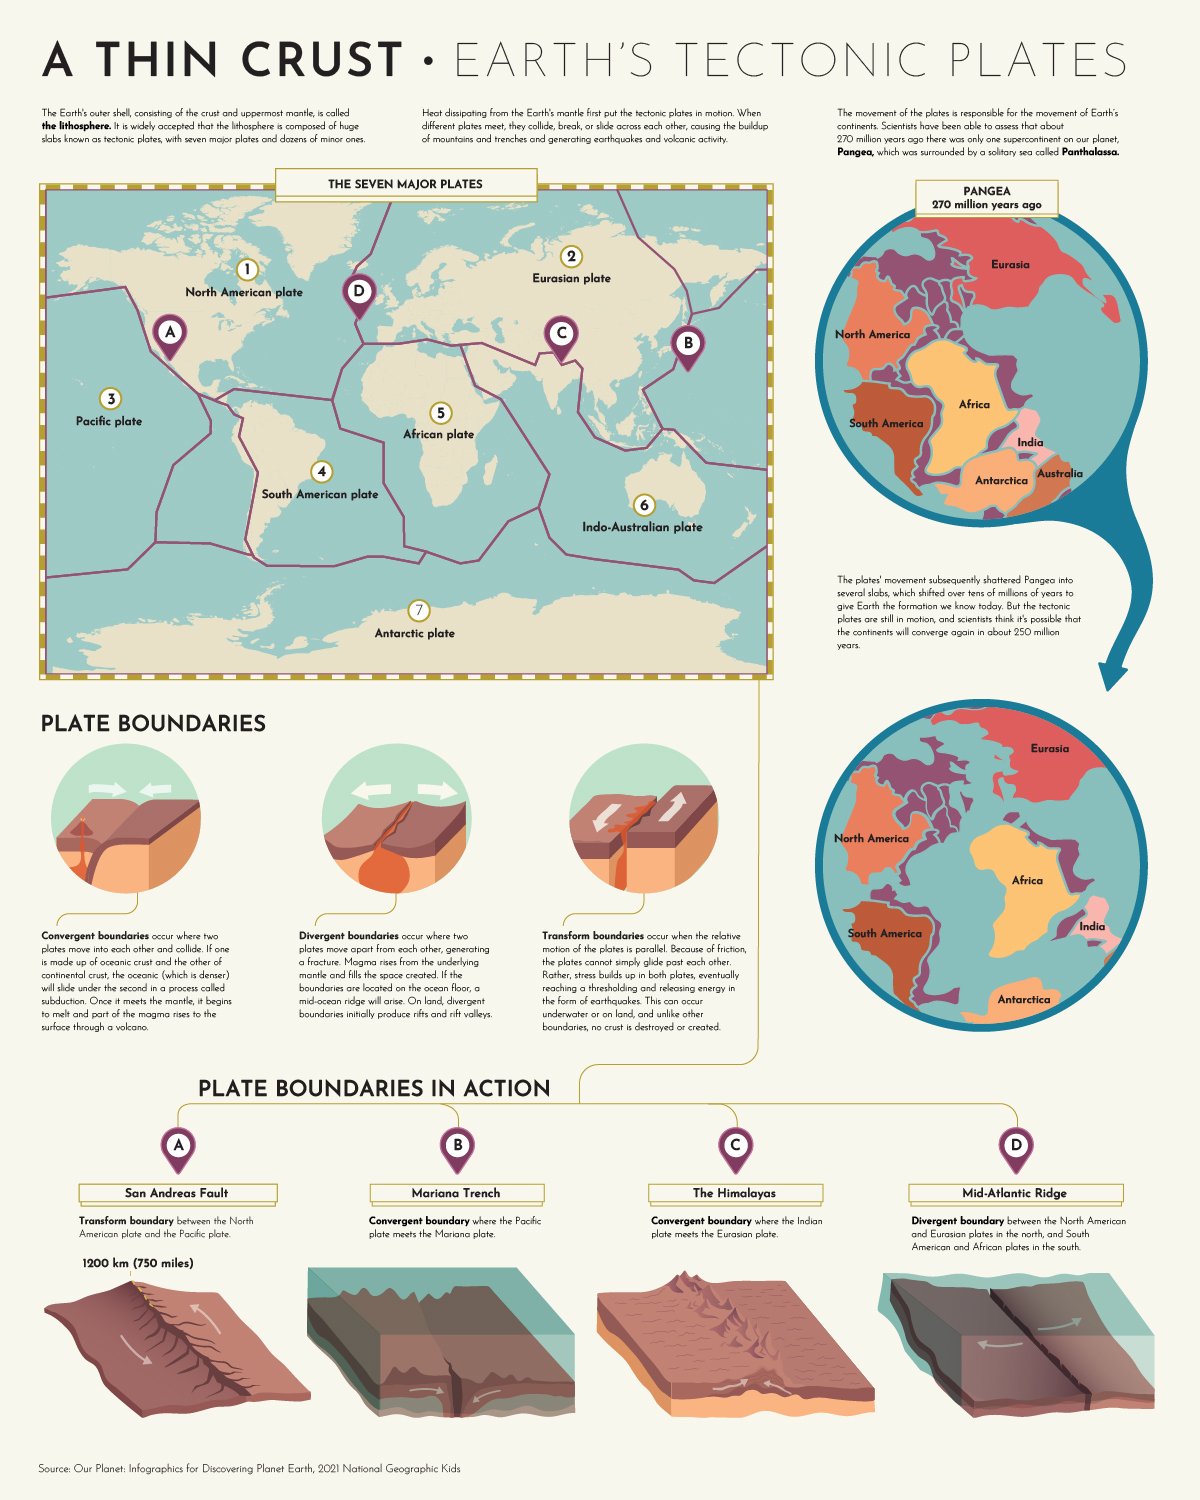
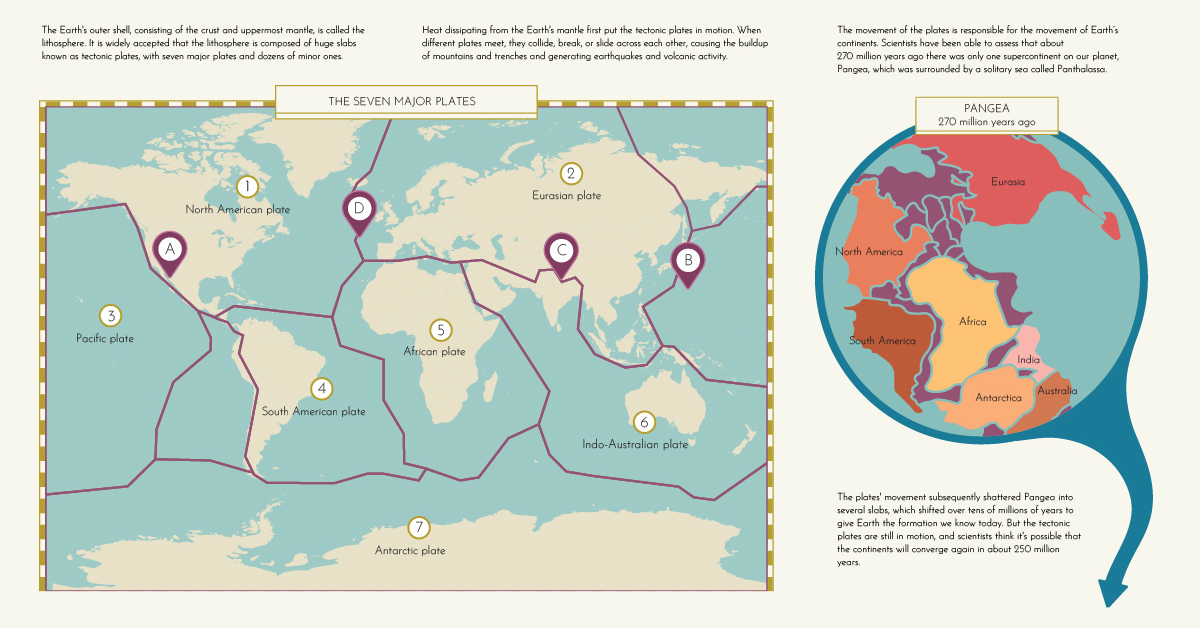
It’s widely understood that Earth’s lithosphere (or outer crust) is made up of moving slabs of rock, better known as the tectonic plates.
These plates only move a couple of inches each year. However, these tiny movements add up over time and cause some of Earth’s most well-known phenomena. Today, the Earth looks a lot different than it did millions of years ago.
This graphic by Giulia De Amicis provides a brief explanation of plate tectonic theory and shows a map of the seven major plates.
Plate Tectonic Theory
In the early 20th century, German geologist Alfred Wegener published a paper on his theory called continental drift—a hypothesis that Earth’s continents were moving across Earth, and sometimes, even colliding into one another.
According to Wegener’s theory, Earth’s continents were once joined as a single, giant landmass, which he called Pangaea. But over time, Pangaea broke apart and formed the continents as we know them today.
Wegener couldn’t explain why this phenomenon was happening, so at the time, his theory was heavily criticized by his colleagues. But over the years, technological advances allowed scientists to study the Earth more closely, and geologists started to build on Wegener’s theory.
Discoveries like seafloor spreading helped explain the “why” behind continental movement, and eventually, Wegener’s initial continental drift theory morphed into plate tectonic theory. And now, the idea that Earth’s crust is slowly moving beneath our feet is widely accepted.
The Seven Major Tectonic Plates
There are seven major plates, and dozens of minor plates, that make up the outer crust of the Earth. The big seven are:
- North American plate
- Eurasian plate
- Pacific plate
- South American plate
- African plate
- Indo-Australian plate
- Antarctic plate
The areas between these plates are known as plate boundaries, and their interactions cause some crazy things to happen on Earth’s surface. There are three types of plate boundaries:
1. Divergent boundary
A divergent boundary is when two plates move away from each other, which creates a fracture in the lithosphere.
A well-known divergent boundary is the Mid-Atlantic Ridge, which runs approximately 10,000 miles from the Arctic Ocean all the way down to the south of Africa.
2. Convergent boundary
A convergent boundary is when two plates collide with one another.
If the collision is between oceanic crust and continental crust, the denser oceanic crust slides underneath the other plate, which is a process known as subduction.
When two continental crusts collide, the rock folds and lifts at the boundary, creating mountains like the Himalayas (where the Indian plate meets the Eurasian plate).
3. Transform Boundary
When two plates move parallel to one another, their meeting point is called a transform boundary.
The friction causes tension. Eventually, that tension needs to be released, which can cause earthquakes. The San Andreas Fault is a well-known major transform boundary between the North American and Pacific plates—it caused the infamous San Francisco earthquake of 1906.

This article was published as a part of Visual Capitalist's Creator Program, which features data-driven visuals from some of our favorite Creators around the world.


Misc
How Hard Is It to Get Into an Ivy League School?
We detail the admission rates and average annual cost for Ivy League schools, as well as the median SAT scores required to be accepted.


How Hard Is It to Get Into an Ivy League School?
This was originally posted on our Voronoi app. Download the app for free on iOS or Android and discover incredible data-driven charts from a variety of trusted sources.
Ivy League institutions are renowned worldwide for their academic excellence and long-standing traditions. But how hard is it to get into one of the top universities in the U.S.?
In this graphic, we detail the admission rates and average annual cost for Ivy League schools, as well as the median SAT scores required to be accepted. The data comes from the National Center for Education Statistics and was compiled by 24/7 Wall St.
Note that “average annual cost” represents the net price a student pays after subtracting the average value of grants and/or scholarships received.
Harvard is the Most Selective
The SAT is a standardized test commonly used for college admissions in the United States. It’s taken by high school juniors and seniors to assess their readiness for college-level academic work.
When comparing SAT scores, Harvard and Dartmouth are among the most challenging universities to gain admission to. The median SAT scores for their students are 760 for reading and writing and 790 for math. Still, Harvard has half the admission rate (3.2%) compared to Dartmouth (6.4%).
| School | Admission rate (%) | SAT Score: Reading & Writing | SAT Score: Math | Avg Annual Cost* |
|---|---|---|---|---|
| Harvard University | 3.2 | 760 | 790 | $13,259 |
| Columbia University | 3.9 | 750 | 780 | $12,836 |
| Yale University | 4.6 | 760 | 780 | $16,341 |
| Brown University | 5.1 | 760 | 780 | $26,308 |
| Princeton University | 5.7 | 760 | 780 | $11,080 |
| Dartmouth College | 6.4 | 760 | 790 | $33,023 |
| University of Pennsylvania | 6.5 | 750 | 790 | $14,851 |
| Cornell University | 7.5 | 750 | 780 | $29,011 |
*Costs after receiving federal financial aid.
Additionally, Dartmouth has the highest average annual cost at $33,000. Princeton has the lowest at $11,100.
While student debt has surged in the United States in recent years, hitting $1.73 trillion in 2023, the worth of obtaining a degree from any of the schools listed surpasses mere academics. This is evidenced by the substantial incomes earned by former students.
Harvard grads, for example, have the highest average starting salary in the country, at $91,700.

-

 Real Estate2 weeks ago
Visualizing America’s Shortage of Affordable Homes
-

 Technology1 week ago
Ranked: Semiconductor Companies by Industry Revenue Share
-

 Money1 week ago
Which States Have the Highest Minimum Wage in America?
-

 Real Estate1 week ago
Ranked: The Most Valuable Housing Markets in America
-

 Business2 weeks ago
Charted: Big Four Market Share by S&P 500 Audits
-

 AI2 weeks ago
The Stock Performance of U.S. Chipmakers So Far in 2024
-

 Misc2 weeks ago
Almost Every EV Stock is Down After Q1 2024
-

 Money2 weeks ago
Where Does One U.S. Tax Dollar Go?