

We visualize inflation rates across G20 countries as of Feb 2024, in the context of their COVID-19 pandemic peak.


We round up the most popular, most discussed, and most liked visualizations of the month on Voronoi, our new data storytelling platform.
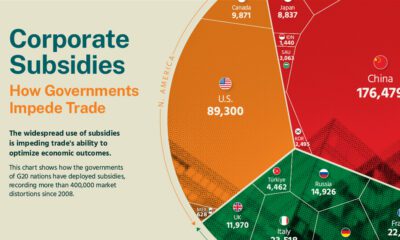

The Hinrich Foundation visualizes the impact of corporate subsidies by G20 nations between 2008 and Q1 2023.
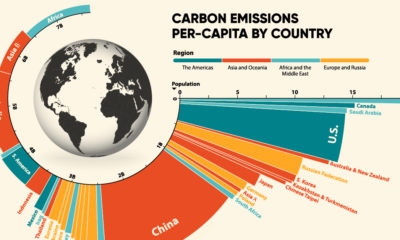

33.6 Gt of CO2 was emitted across the world in 2019. Here we visualize the global per capita CO2 emissions by country and region.


