

See how much the debt-to-GDP ratios of advanced economies have grown (or shrank) since the year 2000.


We visualized product categories that saw the highest % increase in price due to U.S. inflation as of March 2024.
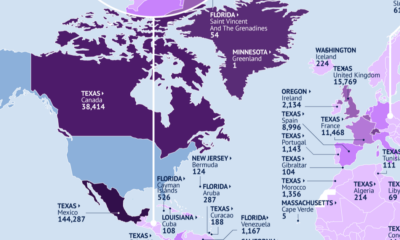

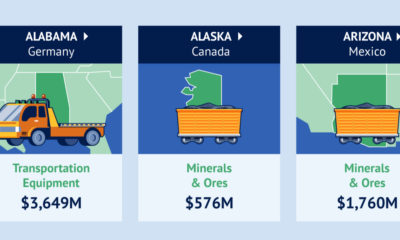
This map identifies the biggest U.S. export markets by state, showing the top partner of each country by value of goods imported.

Canada is the top destination for products from 21 states.


We visualize inflation rates across G20 countries as of Feb 2024, in the context of their COVID-19 pandemic peak.


This visual heatmap of unemployment claims by state highlights New York, California, and Alaska leading the country by a wide margin.


This graphic compares the nominal vs. inflation-adjusted value of the U.S. minimum wage, from 1940 to 2023.


Will the global economy be stronger in 2024 than in 2023?


This visualization looks at how past interest rate cut cycles have gone and the rate cut forecasts by top institutions for 2024.
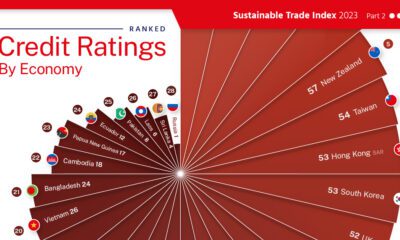

This graphic visualizes 30 country's credit ratings, using data from the 2023 Sustainable Trade Index.


 Creator Program