Markets
Visualized: Past Interest Rate Cut Cycles and 2024 Forecasts
This visual is part of our 2024 Global Forecast Series. For full access to the series, learn more here.
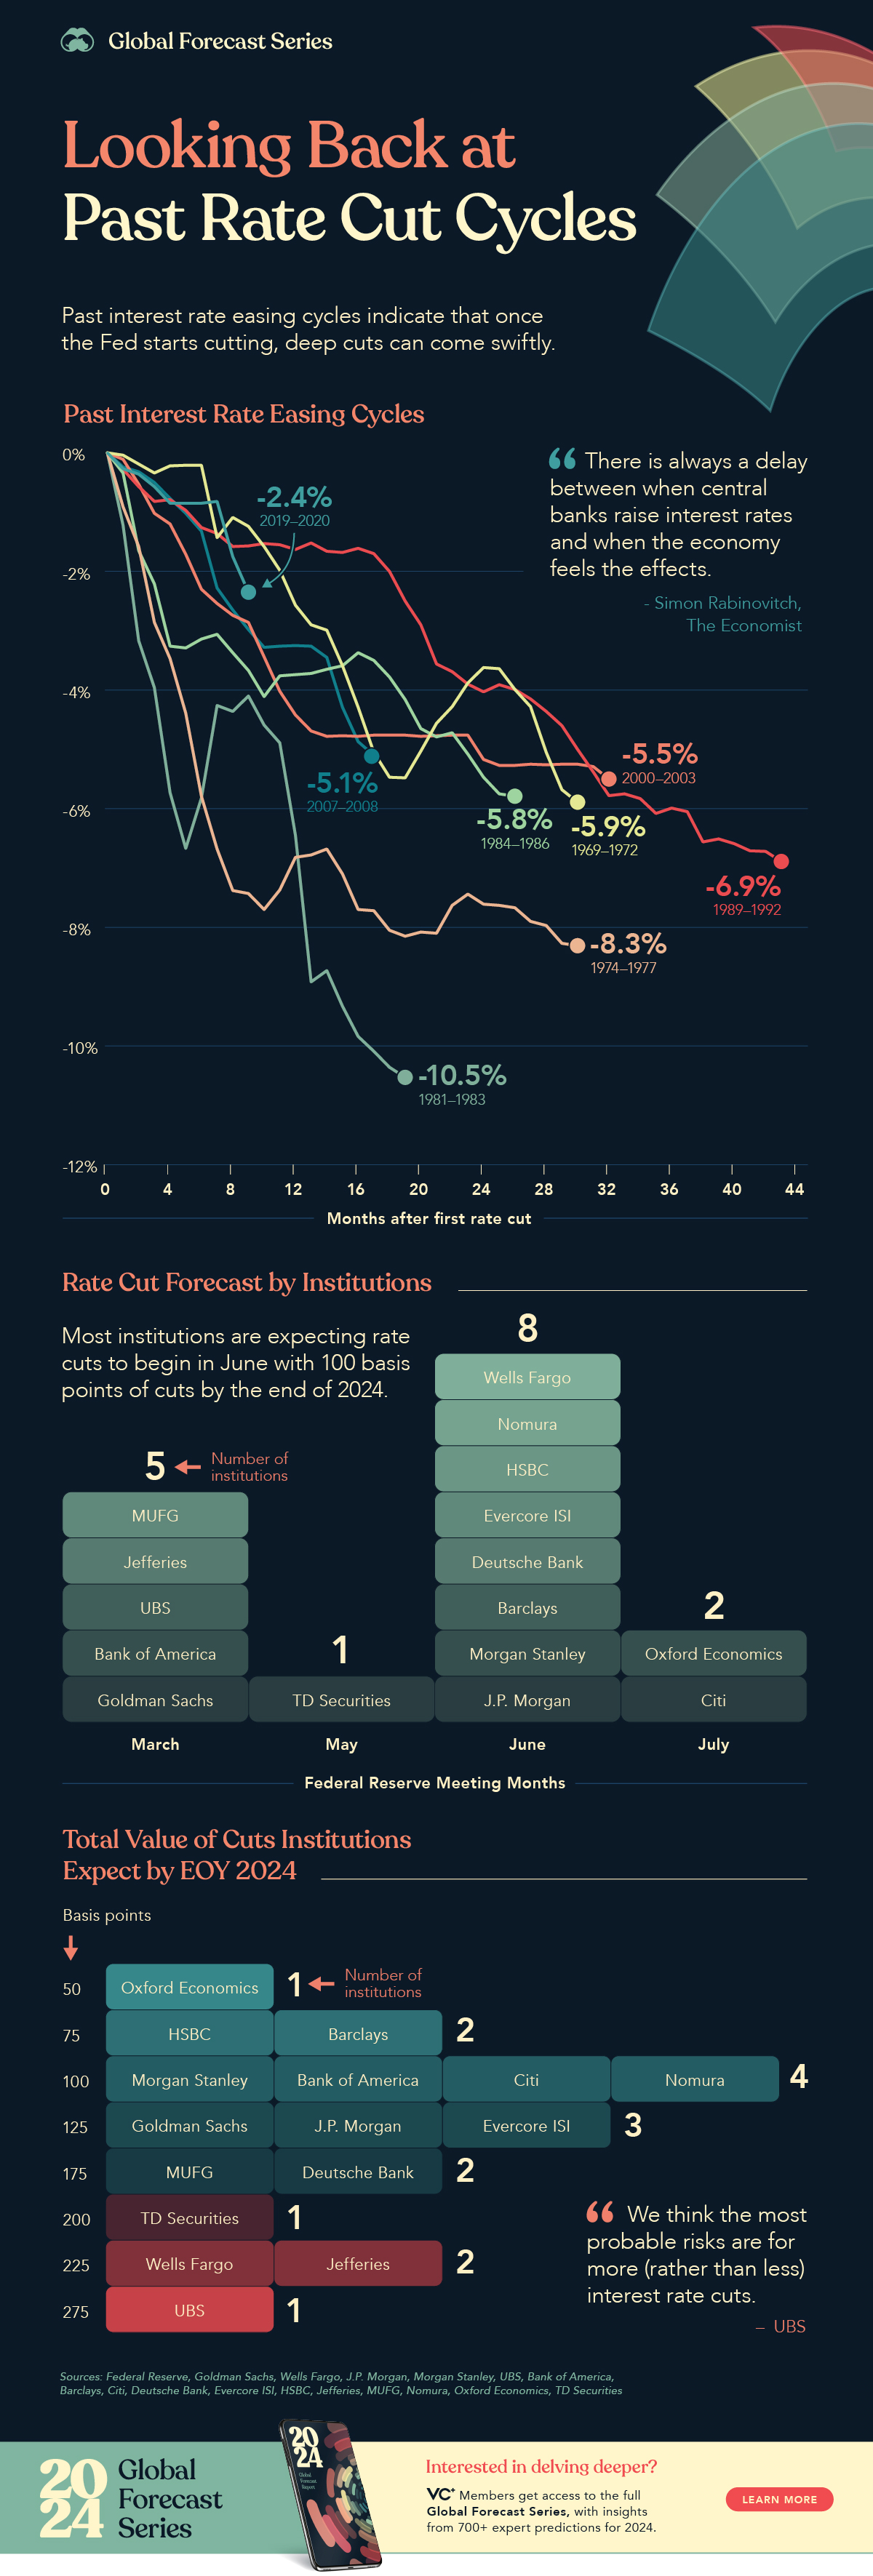
Past Interest Rate Cut Cycles and 2024 Rate Cut Forecasts
A key question mark for the U.S. and global economy is around when the Federal Reserve will cut interest rates in 2024 and by how much.
After a rapid set of rate hikes throughout 2022, the U.S. Federal Reserve now faces the challenge of timing its easing of monetary policy to ensure a soft landing for the economy.
This visualization from our 2024 Global Forecast Series uses data from the Federal Reserve to chart past interest rate cut cycles and visualizes forecasts by top banks and institutions on when they expect the first rate cut of 2024 and the number of cuts they expect by end of year.
Looking Back at Past Interest Rate Cuts Cycles
While interest rate cycles are an economic balancing act which must be carefully managed, rate hikes and cuts of the past have typically been steep and swift.
Looking back at past interest rate cuts for historical context, we can see how quickly these easing cycles played out, especially those in the 1970s and 1980s.
| Interest Rate Cut Cycle | Rate Cut Cycle Duration (months) | Total Rate Cuts |
|---|---|---|
| 2019-2020 | 10 | -2.35% |
| 2007-2008 | 18 | -5.10% |
| 2000-2003 | 33 | -5.50% |
| 1989-1992 | 44 | -6.89% |
| 1984-1986 | 27 | -5.79% |
| 1981-1983 | 20 | -10.53% |
| 1974-1977 | 31 | -8.31% |
| 1969-1972 | 31 | -5.89% |
Rate cuts typically begin once the Federal Reserve has confirmation that the economy has slowed down and inflationary pressures have subsided. Nearly every interest rate cutting cycle has seen the economy enter a recession right before or after rate cuts have started.
“There is always a delay between when central banks raise interest rates and when the economy feels the effects.”
– Simon Rabinovitch, The Economist
While the recessions occur around the time rates are cut, they’re usually a delayed effect from the tighter financial conditions caused by rate hikes, with cuts bringing looser and more accommodative financial conditions for the economy down the line.

Institutional Forecasts for Interest Rate Cuts in 2024
After some of the most rapid rate hikes in history kicked off this latest interest rate cycle in 2022, market participants and banks are leaning towards similarly rapid set of rate cuts in 2024.
Most institutions, including J.P. Morgan, Deutsche Bank, and Morgan Stanley, are expecting the Fed’s first rate cut to occur at the mid-point of the year in June. There is a group of outliers which includes UBS, Bank of America, and Goldman Sachs, that are expecting the first rate cut as early as March.
When it comes to the total amount of interest rate cuts we’ll see in 2024, the majority of institutions are forecasting around 100 to 125 basis points (bps) in rate cuts, which would bring the Federal Funds Rate to around 4-4.25%.
Rate Cuts or Not, is a Recession Inevitable?
While nearly every interest rate cycle of the past has experienced a recession around the time of rate cuts, Federal Reserve Chair Jerome Powell is optimistic that this time may be different.
“I have always felt, since the beginning, that there was a possibility, because of the unusual situation, that the economy could cool off in a way that enabled inflation to come down without the kind of large job losses that have often been associated with high inflation and tightening cycles.
So far, that’s what we’re seeing.”
– Jerome Powell, Chair of the U.S. Federal Reserve
With FOMC members themselves projecting more conservative rate cuts in 2024 with a forecasted median year-end rate of 4.6%, time will tell whether more conservative or agressive rate cuts this year will manage to keep the economy out of a recession.


Markets
The European Stock Market: Attractive Valuations Offer Opportunities
On average, the European stock market has valuations that are nearly 50% lower than U.S. valuations. But how can you access the market?


European Stock Market: Attractive Valuations Offer Opportunities
Europe is known for some established brands, from L’Oréal to Louis Vuitton. However, the European stock market offers additional opportunities that may be lesser known.
The above infographic, sponsored by STOXX, outlines why investors may want to consider European stocks.
Attractive Valuations
Compared to most North American and Asian markets, European stocks offer lower or comparable valuations.
| Index | Price-to-Earnings Ratio | Price-to-Book Ratio |
|---|---|---|
| EURO STOXX 50 | 14.9 | 2.2 |
| STOXX Europe 600 | 14.4 | 2 |
| U.S. | 25.9 | 4.7 |
| Canada | 16.1 | 1.8 |
| Japan | 15.4 | 1.6 |
| Asia Pacific ex. China | 17.1 | 1.8 |
Data as of February 29, 2024. See graphic for full index names. Ratios based on trailing 12 month financials. The price to earnings ratio excludes companies with negative earnings.
On average, European valuations are nearly 50% lower than U.S. valuations, potentially offering an affordable entry point for investors.
Research also shows that lower price ratios have historically led to higher long-term returns.
Market Movements Not Closely Connected
Over the last decade, the European stock market had low-to-moderate correlation with North American and Asian equities.
The below chart shows correlations from February 2014 to February 2024. A value closer to zero indicates low correlation, while a value of one would indicate that two regions are moving in perfect unison.
| EURO STOXX 50 | STOXX EUROPE 600 | U.S. | Canada | Japan | Asia Pacific ex. China |
|
|---|---|---|---|---|---|---|
| EURO STOXX 50 | 1.00 | 0.97 | 0.55 | 0.67 | 0.24 | 0.43 |
| STOXX EUROPE 600 | 1.00 | 0.56 | 0.71 | 0.28 | 0.48 | |
| U.S. | 1.00 | 0.73 | 0.12 | 0.25 | ||
| Canada | 1.00 | 0.22 | 0.40 | |||
| Japan | 1.00 | 0.88 | ||||
| Asia Pacific ex. China | 1.00 |
Data is based on daily USD returns.
European equities had relatively independent market movements from North American and Asian markets. One contributing factor could be the differing sector weights in each market. For instance, technology makes up a quarter of the U.S. market, but health care and industrials dominate the broader European market.
Ultimately, European equities can enhance portfolio diversification and have the potential to mitigate risk for investors.
Tracking the Market
For investors interested in European equities, STOXX offers a variety of flagship indices:
| Index | Description | Market Cap |
|---|---|---|
| STOXX Europe 600 | Pan-regional, broad market | €10.5T |
| STOXX Developed Europe | Pan-regional, broad-market | €9.9T |
| STOXX Europe 600 ESG-X | Pan-regional, broad market, sustainability focus | €9.7T |
| STOXX Europe 50 | Pan-regional, blue-chip | €5.1T |
| EURO STOXX 50 | Eurozone, blue-chip | €3.5T |
Data is as of February 29, 2024. Market cap is free float, which represents the shares that are readily available for public trading on stock exchanges.
The EURO STOXX 50 tracks the Eurozone’s biggest and most traded companies. It also underlies one of the world’s largest ranges of ETFs and mutual funds. As of November 2023, there were €27.3 billion in ETFs and €23.5B in mutual fund assets under management tracking the index.
“For the past 25 years, the EURO STOXX 50 has served as an accurate, reliable and tradable representation of the Eurozone equity market.”
— Axel Lomholt, General Manager at STOXX
Partnering with STOXX to Track the European Stock Market
Are you interested in European equities? STOXX can be a valuable partner:
- Comprehensive, liquid and investable ecosystem
- European heritage, global reach
- Highly sophisticated customization capabilities
- Open architecture approach to using data
- Close partnerships with clients
- Part of ISS STOXX and Deutsche Börse Group
With a full suite of indices, STOXX can help you benchmark against the European stock market.
Learn how STOXX’s European indices offer liquid and effective market access.

-

 Economy2 days ago
Economic Growth Forecasts for G7 and BRICS Countries in 2024
The IMF has released its economic growth forecasts for 2024. How do the G7 and BRICS countries compare?
-

 Markets1 week ago
U.S. Debt Interest Payments Reach $1 Trillion
U.S. debt interest payments have surged past the $1 trillion dollar mark, amid high interest rates and an ever-expanding debt burden.
-

 United States2 weeks ago
Ranked: The Largest U.S. Corporations by Number of Employees
We visualized the top U.S. companies by employees, revealing the massive scale of retailers like Walmart, Target, and Home Depot.
-

 Markets2 weeks ago
The Top 10 States by Real GDP Growth in 2023
This graphic shows the states with the highest real GDP growth rate in 2023, largely propelled by the oil and gas boom.
-

 Markets2 weeks ago
Ranked: The World’s Top Flight Routes, by Revenue
In this graphic, we show the highest earning flight routes globally as air travel continued to rebound in 2023.
-

 Markets3 weeks ago
Ranked: The Most Valuable Housing Markets in America
The U.S. residential real estate market is worth a staggering $47.5 trillion. Here are the most valuable housing markets in the country.

-

 Debt1 week ago
How Debt-to-GDP Ratios Have Changed Since 2000
-
Markets2 weeks ago
Ranked: The World’s Top Flight Routes, by Revenue
-

 Countries2 weeks ago
Population Projections: The World’s 6 Largest Countries in 2075
-
Markets2 weeks ago
The Top 10 States by Real GDP Growth in 2023
-

 Demographics2 weeks ago
The Smallest Gender Wage Gaps in OECD Countries
-

 United States2 weeks ago
Where U.S. Inflation Hit the Hardest in March 2024
-

 Green2 weeks ago
Top Countries By Forest Growth Since 2001
-
United States2 weeks ago
Ranked: The Largest U.S. Corporations by Number of Employees