

See how much the debt-to-GDP ratios of advanced economies have grown (or shrank) since the year 2000.


We visualized product categories that saw the highest % increase in price due to U.S. inflation as of March 2024.
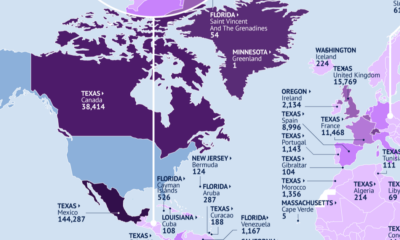

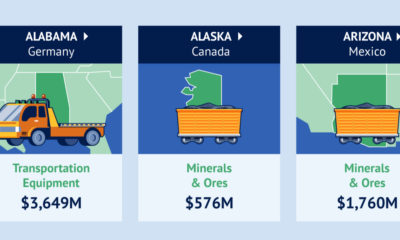
This map identifies the biggest U.S. export markets by state, showing the top partner of each country by value of goods imported.


We visualize the results of a YouGov survey that determined the most popular beers among each U.S. generation.

Canada is the top destination for products from 21 states.


This graphic compares the nominal vs. inflation-adjusted value of the U.S. minimum wage, from 1940 to 2023.


This graphic illustrates the biggest stock markets by country, providing a unique breakdown of $110 trillion in valuation.
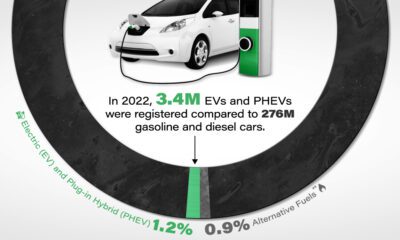

Although sales have been climbing, EV market share in the U.S. remains low as a percentage of all vehicles registered on the road.


SUVs and trucks were the best selling vehicle in almost every US state for 2022, but a few surprises remain.
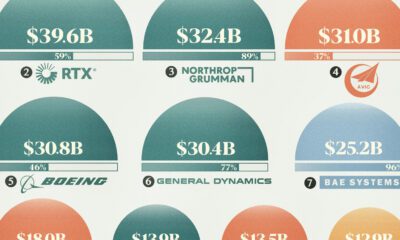

With billions in defense contracts handed out annually, who are the key players profiting? View this graphic to find out.


 Creator Program