

This visualization looks at how past interest rate cut cycles have gone and the rate cut forecasts by top institutions for 2024.
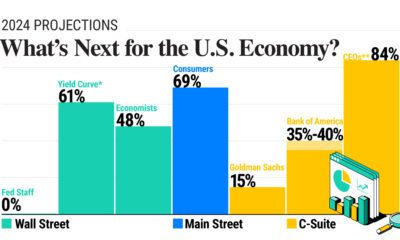

In this graphic, we show the probability of a U.S. recession in 2024, based on forecasts from Wall Street, Main Street, and the C-Suite.
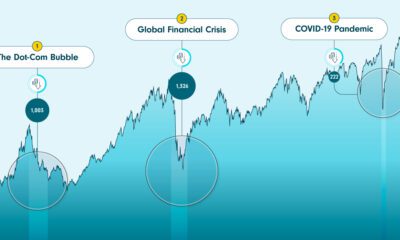

The S&P/TSX Composite Index withstood three recessions in 2000, 2008, and 2020. Through their build-up, crashes, and recoveries, valuable lessons emerged.
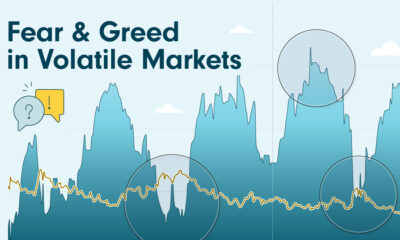

CNN's Fear & Greed Index captures investor confidence levels, usually reflecting market volatility. It increases during periods of greed in the markets and decreases when investors...
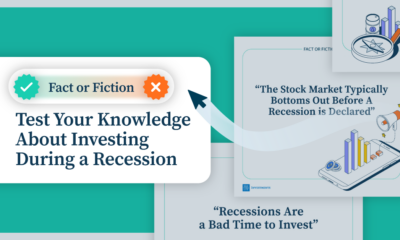

From sector performance to market recoveries, test your knowledge about investing during a recession with this interactive quiz.
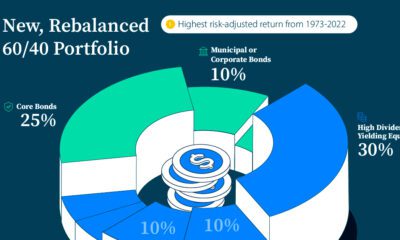

Amid uncertain economic times, a new allocation for the 60/40 portfolio may help investors target higher risk-adjusted returns.
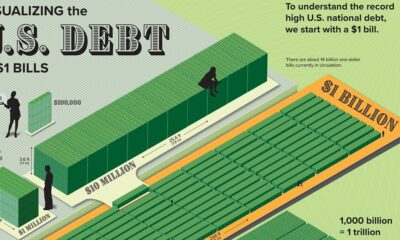

Can you picture what $31.4 trillion looks like? This graphic stacks up $1 bills to visualize U.S. debt in physical form.
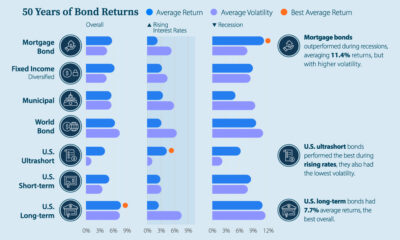

What factors impact the bond market? Here's how current interest rates, bond returns, and market volatility compare in a historical context.


This infographic examines 50 years of data to highlight a clear visual trend: recessions are preceded by a cyclical low in unemployment.


The global economy faces an uncertain future in 2023. This year, GDP growth is projected to be 2.9%—down from 3.2% in 2022.


 Creator Program