Green
The 2023 Utility Decarbonization Index
Data in this visualization comes from the NPUC Annual Utility Decarbonization Report 2023
The 2023 Utility Decarbonization Index
This was originally posted on the Decarbonization Channel. Subscribe to the free mailing list to be the first to see graphics related to decarbonization with a focus on the U.S. energy sector.
Electric utilities and the power sector have a pivotal role to play in decarbonizing the U.S. economy, especially with the electrification of sectors such as transportation.
So, where do the country’s largest electricity producers stand on the path to decarbonization?
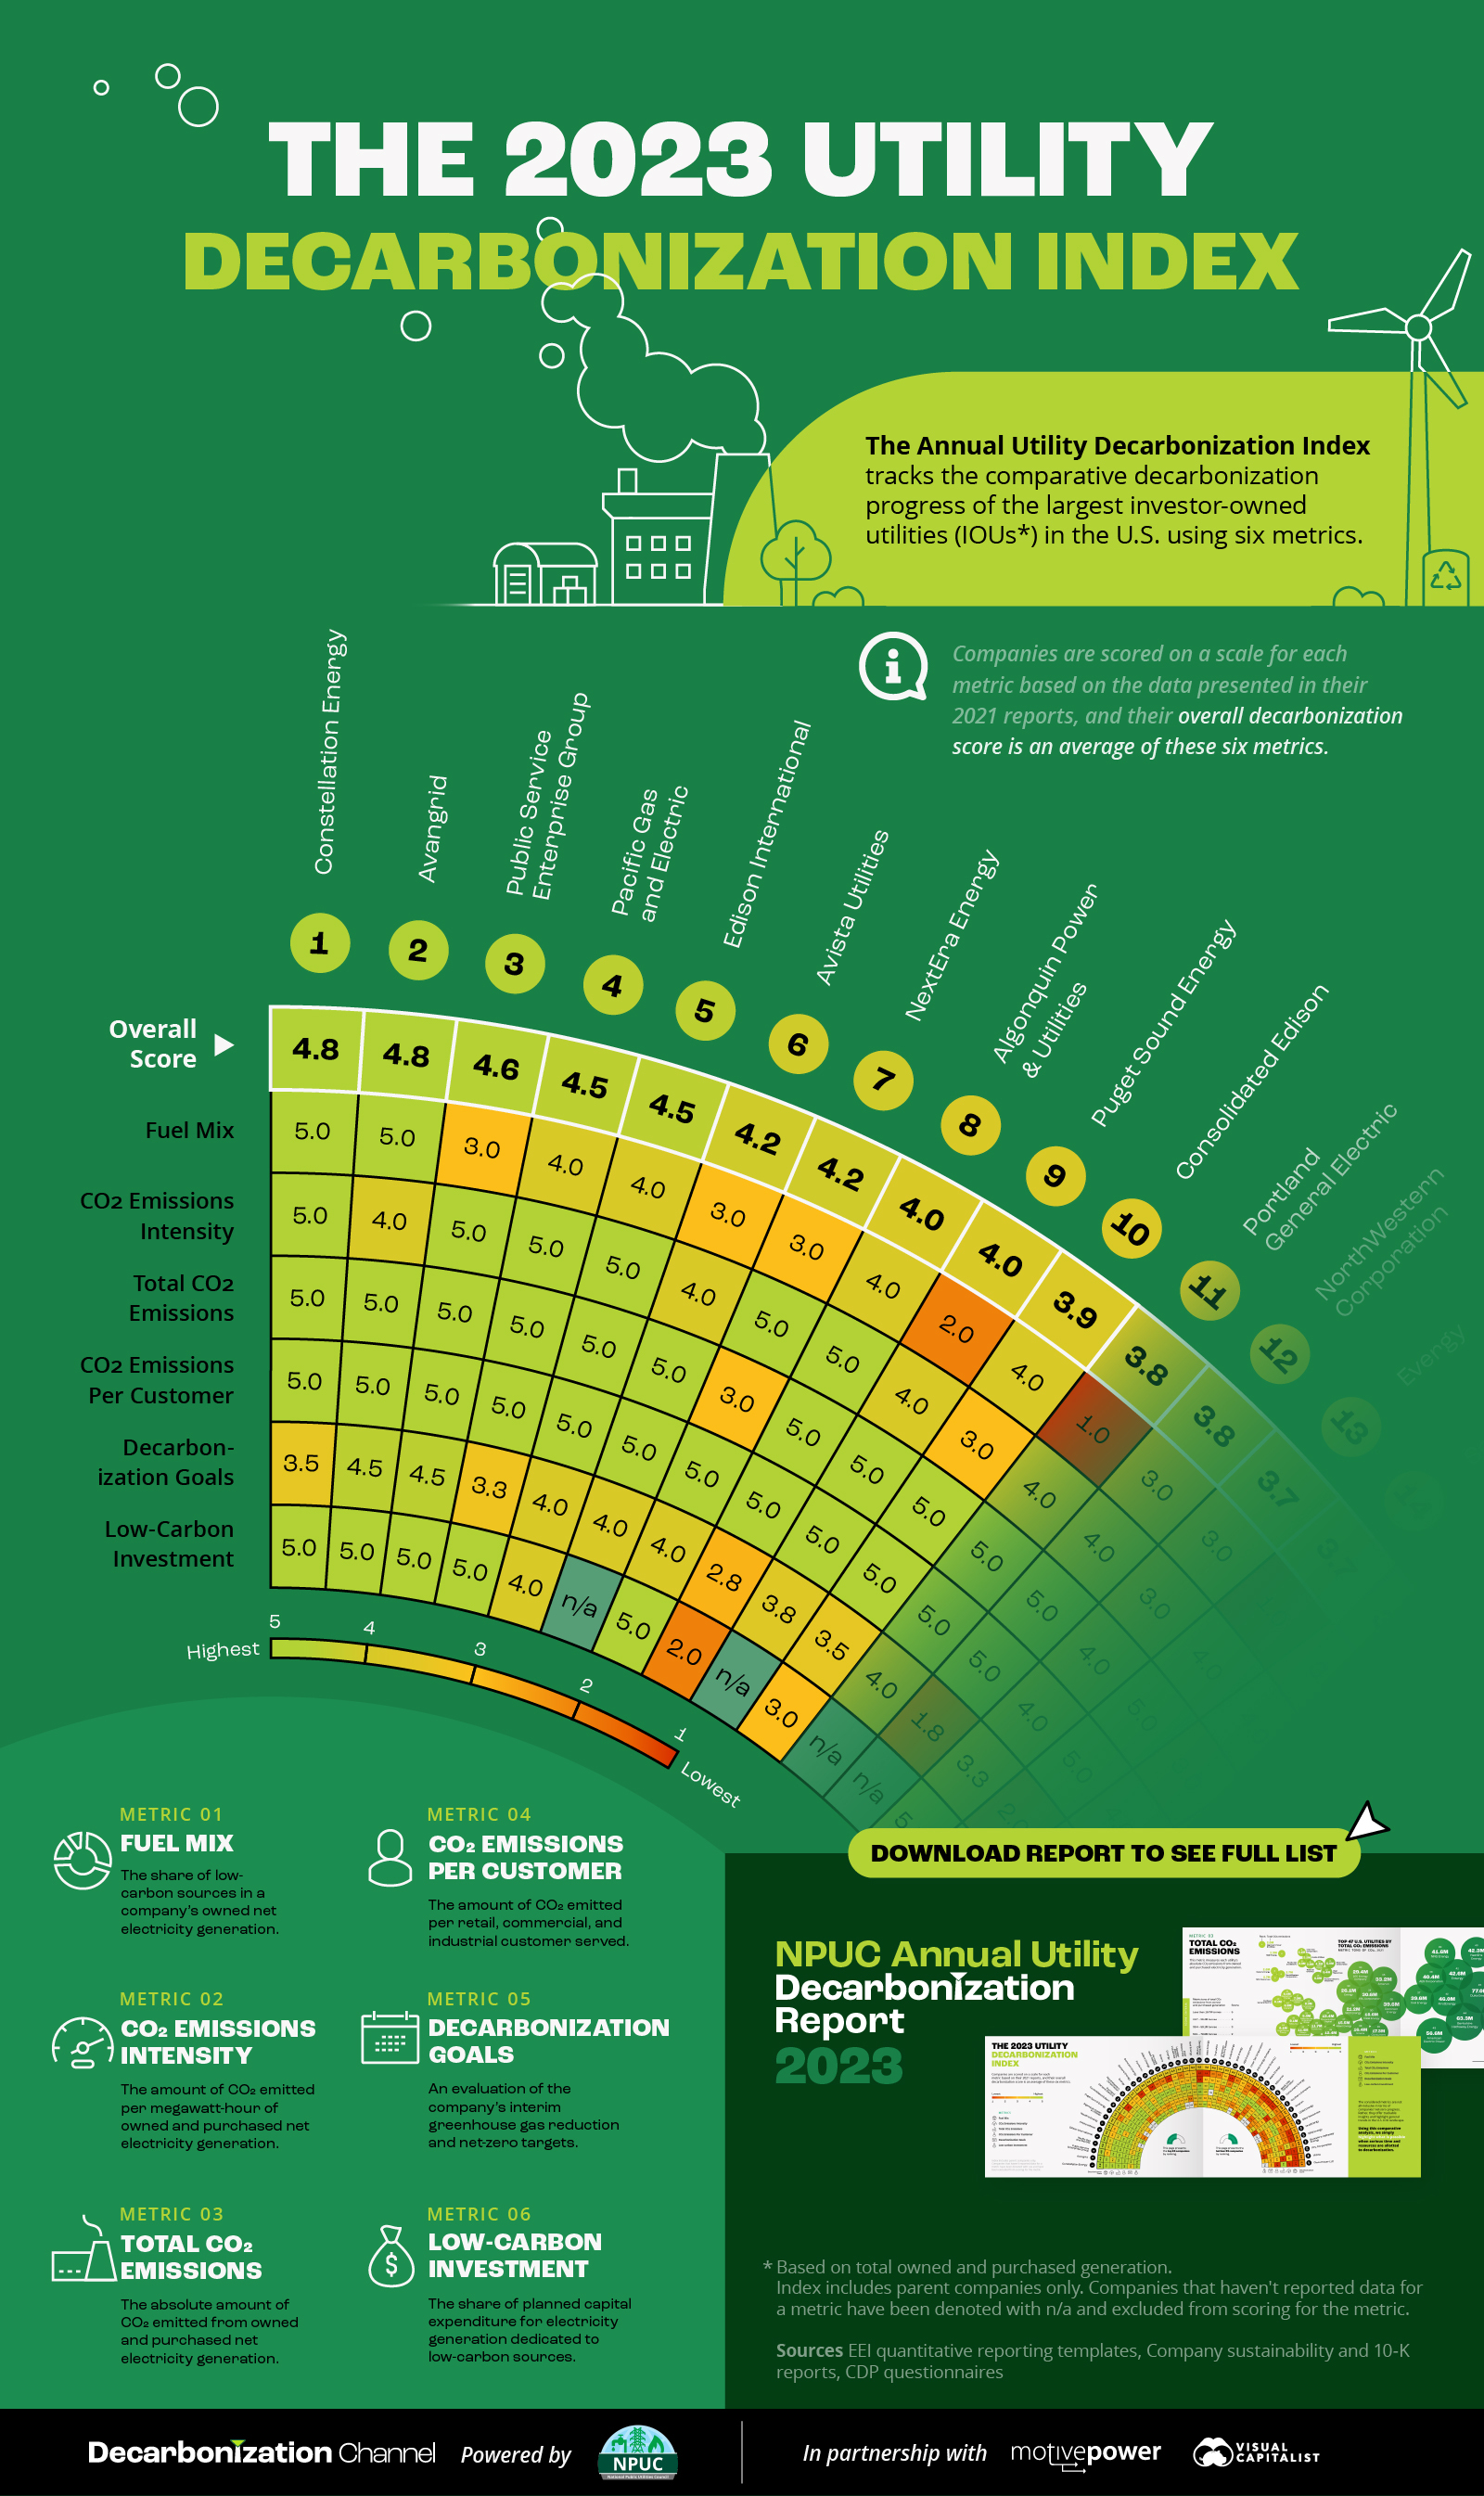
In collaboration with our sponsor National Public Utilities Council, we present the 2023 edition of our Annual Utility Decarbonization Index. The index uses 2021 data (the latest available at the time of data collection) to track the comparative decarbonization progress of the 47 largest investor-owned utilities (IOUs) in the United States.
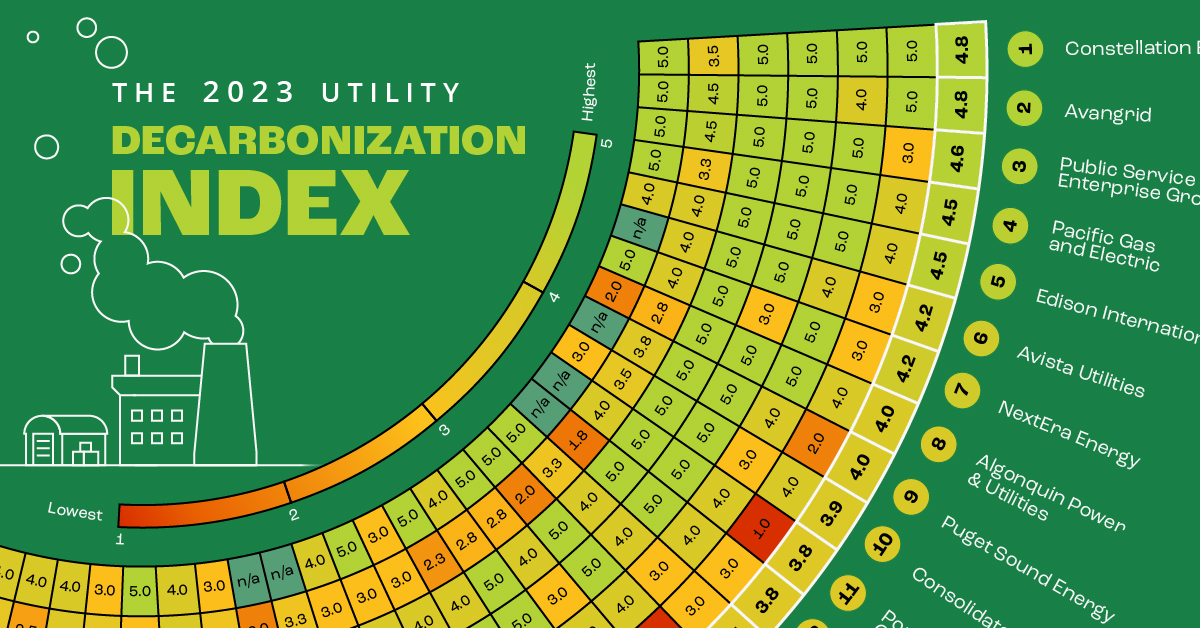
In the graphic above, we give a preview of the top 10 rankers.
Methodology of the Utility Decarbonization Index
The Utility Decarbonization Index uses the following six metrics to track decarbonization progress:
- Fuel Mix
The share of low-carbon sources in a utility’s owned net electricity generation. - CO2 Emissions Intensity
The amount of CO2 emitted per megawatt-hour of owned and purchased net electricity generation. - Total CO2 Emissions
The absolute amount of CO2 emitted from owned and purchased net electricity generation. - CO2 Emissions Per Customer
The amount of CO2 emitted per retail, commercial, and industrial customer served. - Decarbonization Goals
An evaluation of the company’s interim greenhouse gas reduction and net-zero targets, with a 50% reduction in emissions by 2030 and net-zero by 2050 as baseline targets. - Low-Carbon investment
The share of planned capital expenditure for electricity generation dedicated to low-carbon sources.
All 47 IOUs in the Decarbonization Index are scored on a scale of one (lowest) to five (highest) for each of the six metrics, indicating whether they are trailing or leading compared to their peers. A utility’s final decarbonization score is an average of its scores across the six metrics.
The data for these metrics comes from company sustainability reports, quantitative ESG reporting templates from the Edison Electric Institute, and the Climate Disclosure Project’s Climate Change Questionnaire filings.
With the methodology in mind, let’s take a look at the 10 utilities that are leading the ranking in this year’s Utility Decarbonization Index.
The Annual Utility Decarbonization Index 2023
The 47 IOUs ranked in the Index are the largest electricity producers in the country, together representing over 58% of U.S. electricity generation in 2021 and serving 68% of all US. electric customers. Therefore, the decarbonization of these utilities can have a massive impact on the power sector and other electricity-consuming sectors.
However, it’s important to note that a score of five on the Utility Decarbonization Index does not indicate full decarbonization or net-zero emissions. Rather, it indicates that the utility is leading in decarbonization relative to its peers.
Here are the top 10 IOUs in this year’s ranking:
| Rank | Company | Decarbonization score |
|---|---|---|
| #1 | Constellation Energy (Exelon) | 4.8 |
| #2 | Avangrid | 4.8 |
| #3 | Public Service Enterprise Group | 4.6 |
| #4 | Pacific Gas and Electric | 4.5 |
| #5 | Edison International (EIX) | 4.5 |
| #6 | Avista Utilities | 4.2 |
| #7 | NextEra Energy | 4.2 |
| #8 | Algonquin Power & Utilities | 4.0 |
| #9 | Puget Sound Energy (PSE) | 4.0 |
| #10 | Consolidated Edison | 3.9 |
Constellation Energy, a newly formed subsidiary of Exelon, tops this year’s Decarbonization Index along with Avangrid. Constellation is the largest low-carbon electricity producer among the 47 IOUs, with 80% of its owned net electricity generation coming from nuclear power plants. The company also had the lowest CO2 emissions intensity of all utilities in the Index.
Avangrid, a clean energy-focused utility operating in the Northeast, ties for first place thanks to its low-carbon fuel mix and ambitious decarbonization targets to achieve carbon neutrality in Scope 1 and 2 emissions by 2030.
Download the 2023 Annual Utility Decarbonization Report
Are you interested in seeing the rest of the rankings? Check out the full report!
In addition to the Decarbonization Index, there’s much more to unpack, including:
- Six reasons why utilities must decarbonize
- Highlights and challenges to decarbonization from 2021–2022
- The data behind the six individual metrics
- The U.S. Utilities ESG report card
- Decarbonization strategies for U.S. utilities
Download the 2023 NPUC Annual Utility Decarbonization Report and find out everything you need to know about utility decarbonization.


Green
How Carbon Credits Can Help Close the Climate Funding Gap
To keep a 1.5℃ world within reach, global emissions need to fall by as much as 45% by 2030, and carbon credits could help close the gap.


How Carbon Credits Can Help Close the Climate Funding Gap
Governments around the world have committed to the goals of the Paris Agreement, but their climate pledges are insufficient. To keep a 1.5℃ world within reach, global emissions need to fall by as much as 45% by 2030.
Bold and immediate action is essential, but so are resources that will make it happen.
In this graphic, we have partnered with Carbon Streaming to look at the role that the voluntary carbon market and carbon credits can play in closing that gap.
More Funds are Needed for Climate Finance
According to data from the Climate Policy Initiative, climate finance, which includes funds for both adaptation and mitigation, needs to increase at least five-fold, from $1.3T in 2021/2022, to an average $8.6T annually until 2030, and then to just over $10T in the two decades leading up to 2050.
That adds up to a very large number, but consider that in 2022, $7.0T went to fossil fuel subsidies, which almost covers the annual estimated outlay. And the world has shown that when pressed, governments can come up with the money, if the global pandemic is any indication.
Mobilizing Carbon Finance to the Developing World
But the same cannot be said of the developing world, where debt, inequality, and poverty reduce the ability of governments to act. And this is where carbon credits can play an important role. According to analyses from Ecosystem Marketplace, carbon credits help move capital from developed countries, to where funds are needed in the developing world.
For example, in 2019, 69.2% of the carbon credits by volume in the voluntary carbon market were purchased by buyers in Europe, and nearly a third from North America. Compare that to over 90% of the volume of carbon credits sold in the voluntary carbon market in 2022 came from projects that were located outside of those two regions.
Carbon Credits Can Complement Decarbonization Efforts
Carbon credits can also complement decarbonization efforts in the corporate world, where more and more companies have been signing up to reduce emissions. According to the 2022 monitoring report from the Science Based Targets initiative, 4,230 companies around the world had approved targets and commitments, which represented an 88% increase from the prior year. However, as of year end 2022, combined scope 1 and 2 emissions covered by science-based targets totaled approximately 2 GtCO2e, which represents just a fraction of global emissions.
The fine print is that this is just scope 1 and 2 emissions, and doesn’t include scope 3 emissions, which can account for more than 70% of a company’s total emissions. And as these emissions come under greater and greater scrutiny the closer we get to 2030 and beyond, the voluntary carbon credit market could expand exponentially to help meet the need to compensate for these emissions.
Potential Carbon Credit Market Size in 2030
OK, but how big? In 2022, the voluntary carbon credit market was around $2B, but some analysts predict that it could grow to between $5–250 billion by 2030.
| Firm | Low Estimate | High Estimate |
|---|---|---|
| Bain & Company | $15B | $30B |
| Barclays | N/A | $250B |
| Citigroup | $5B | $50B |
| McKinsey & Company | $5B | $50B |
| Morgan Stanley | N/A | $100B |
| Shell / Boston Consulting Group | $10B | $40B |
Morgan Stanley and Barclays were the most bullish on the size of the voluntary carbon credit market in 2030, but the latter firm was even more optimistic about 2050, and predicted that the voluntary carbon credit market could grow to a colossal $1.5 trillion.
Carbon Streaming is Focused on Carbon Credit Integrity
Ultimately, carbon credits could have an important role to play in marshaling the resources needed to keep the world on track to net zero by 2050, and avoiding the worst consequences of a warming world.
Carbon Streaming uses streaming transactions, a proven and flexible funding model, to scale high-integrity carbon credit projects to advance global climate action and UN Sustainable Development Goals.
Learn more at www.carbonstreaming.com.

-

 Green1 week ago
Ranking the Top 15 Countries by Carbon Tax Revenue
This graphic highlights France and Canada as the global leaders when it comes to generating carbon tax revenue.
-

 Green2 weeks ago
Ranked: The Countries With the Most Air Pollution in 2023
South Asian nations are the global hotspot for pollution. In this graphic, we rank the world’s most polluted countries according to IQAir.
-

 Environment2 weeks ago
Top Countries By Forest Growth Since 2001
One country is taking reforestation very seriously, registering more than 400,000 square km of forest growth in two decades.
-

 Green3 weeks ago
Ranked: Top Countries by Total Forest Loss Since 2001
The country with the most forest loss since 2001 lost as much forest cover as the next four countries combined.
-

 Markets2 months ago
The World’s Top Cocoa Producing Countries
Here are the largest cocoa producing countries globally—from Côte d’Ivoire to Brazil—as cocoa prices hit record highs.
-

 Environment2 months ago
Charted: Share of World Forests by Country
We visualize which countries have the biggest share of world forests by area—and while country size plays a factor, so too, does the environment.
-

 Education1 week ago
How Hard Is It to Get Into an Ivy League School?
-

 Technology2 weeks ago
Ranked: Semiconductor Companies by Industry Revenue Share
-

 Markets2 weeks ago
Ranked: The World’s Top Flight Routes, by Revenue
-

 Demographics2 weeks ago
Population Projections: The World’s 6 Largest Countries in 2075
-

 Markets2 weeks ago
The Top 10 States by Real GDP Growth in 2023
-

 Demographics2 weeks ago
The Smallest Gender Wage Gaps in OECD Countries
-

 Economy2 weeks ago
Where U.S. Inflation Hit the Hardest in March 2024
-
Environment2 weeks ago
Top Countries By Forest Growth Since 2001