

Companies benefitting from the AI train and strong retail demand helped their individual S&P 500 sector performance in 2023.
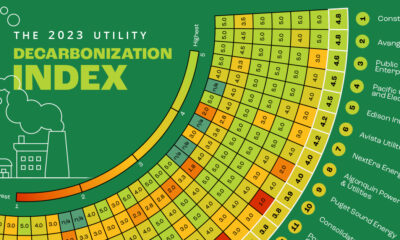

Here's a preview of the 2023 Utility Decarbonization Index, which tracks the decarbonization progress of the largest U.S. utilities.
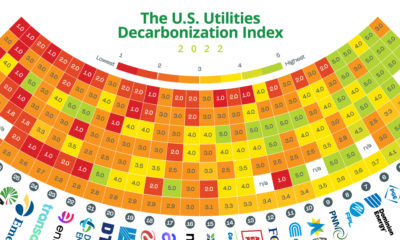

This graphic quantifies and compares the state of decarbonization among the 30 largest investor-owned utilities in the United States.
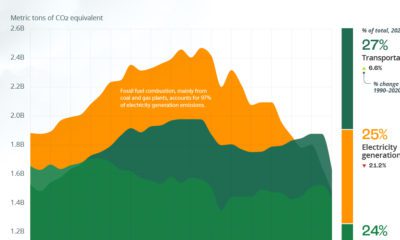

The U.S. emits about 6 billion metric tons of greenhouse gases a year. Here's how these emissions rank by sector.
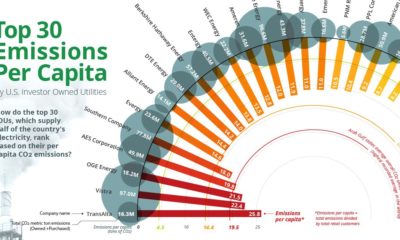

Roughly 25% of all GHG emissions come from electricity production. See how the top 30 IOUs rank by emissions per capita.


Did you know emerging markets gained market share in the technology sector? We show a regional breakdown of stock market sectors over time.
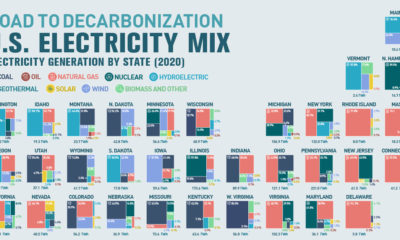

Can America become carbon-free by 2035? This graphic breaks down the United States’ electricity mix, by state.
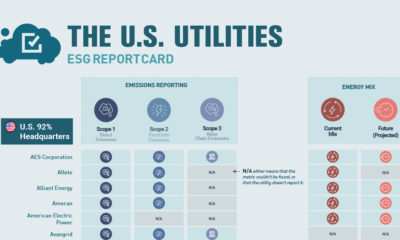

This graphic acts as an ESG report card that tracks the ESG metrics reported by different utilities in the U.S.—what gets left out?
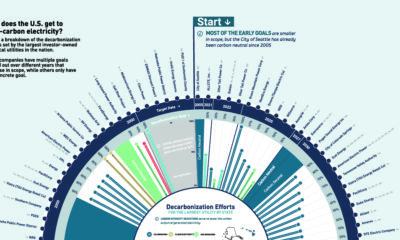

How are utilities reducing carbon emissions? Here are the decarbonization targets of the largest U.S. utilities.


