Visualizing U.S. Greenhouse Gas Emissions by Sector
Visualizing U.S. Emissions by Sector
Decarbonization efforts in the U.S. are ramping up, and in 2020, greenhouse gas (GHG) emissions were lower than at any point during the previous 30 years.
However there’s still work to be done before various organizations, states, and nationwide targets are met. And when looking at GHG emissions by sector, the data suggests that some groups have more work cut out for them than others.
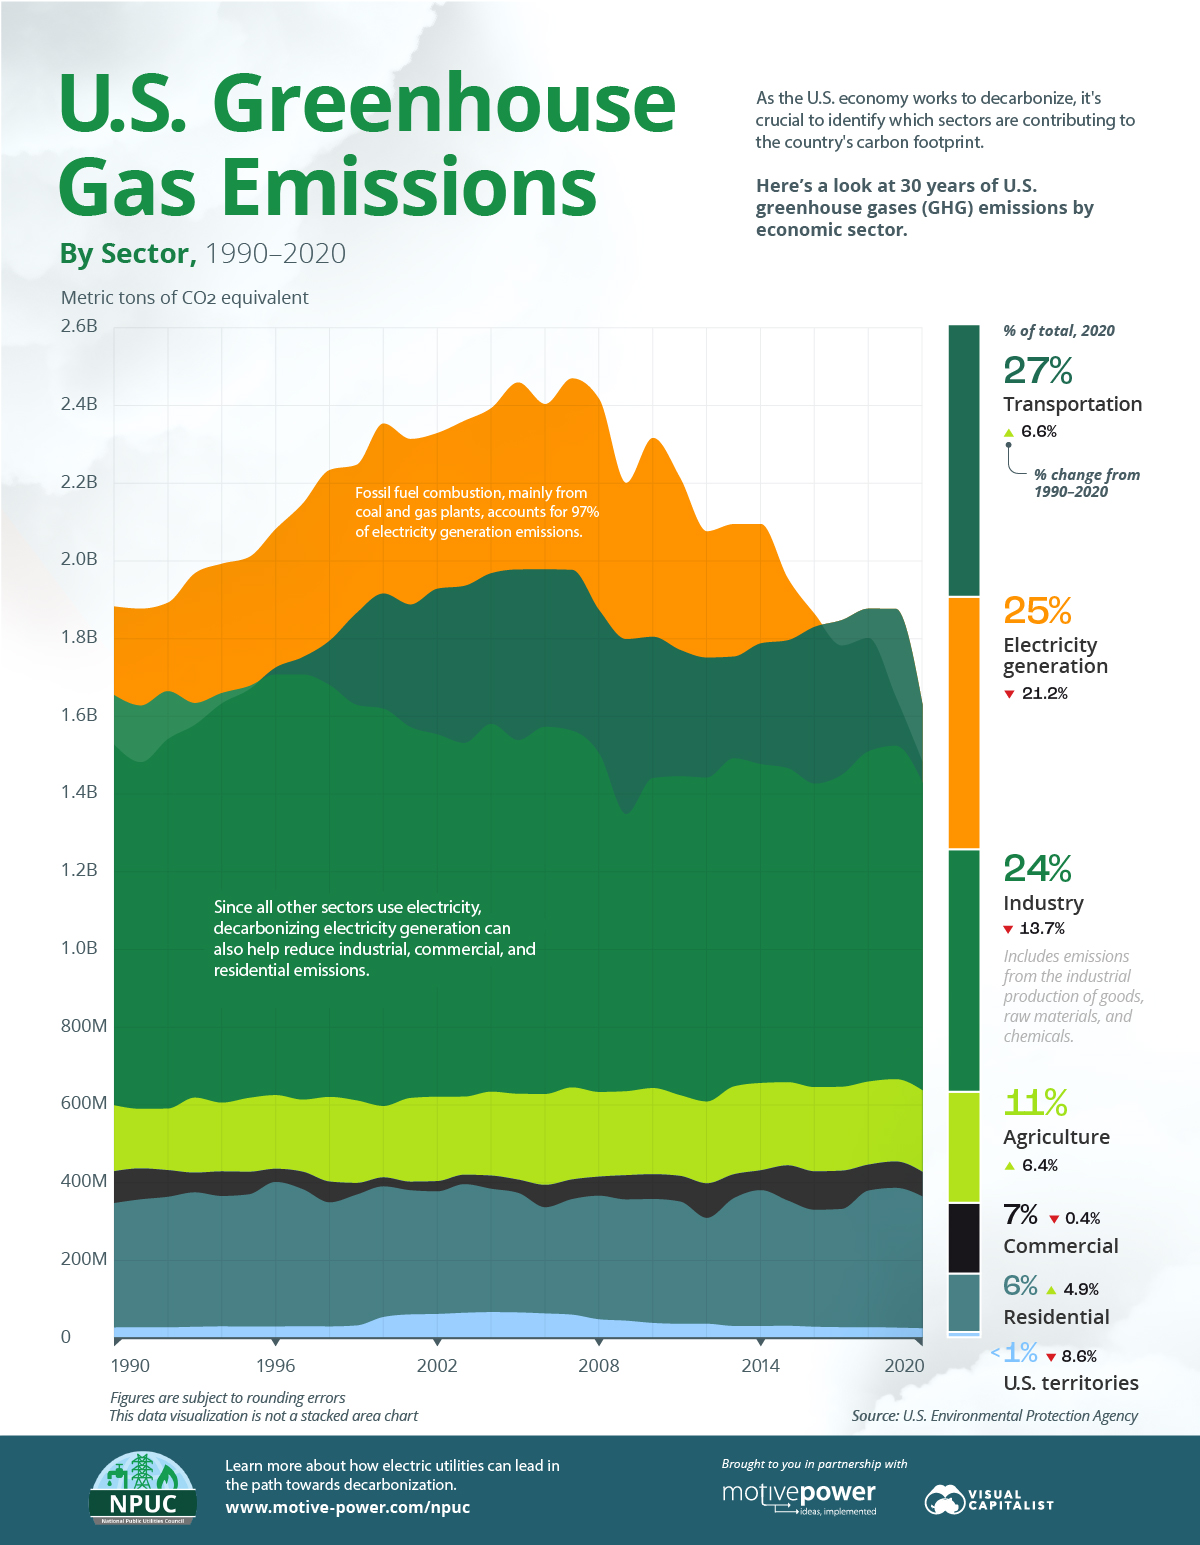
This graphic from the National Public Utilities Council provides the key data and trends on the total emissions by U.S. sector since 1990.
The Highest Emitting Sectors
Collectively, the U.S. emitted 5,981 million metric tons (MMT) of CO2-equivalent (CO2e) emissions in 2020, which rose 6.1% in 2021.
Here’s how the various sectors in the U.S. compare.
| Sector | 2020 GHG emissions, MMT CO2e | Percentage of Total |
|---|---|---|
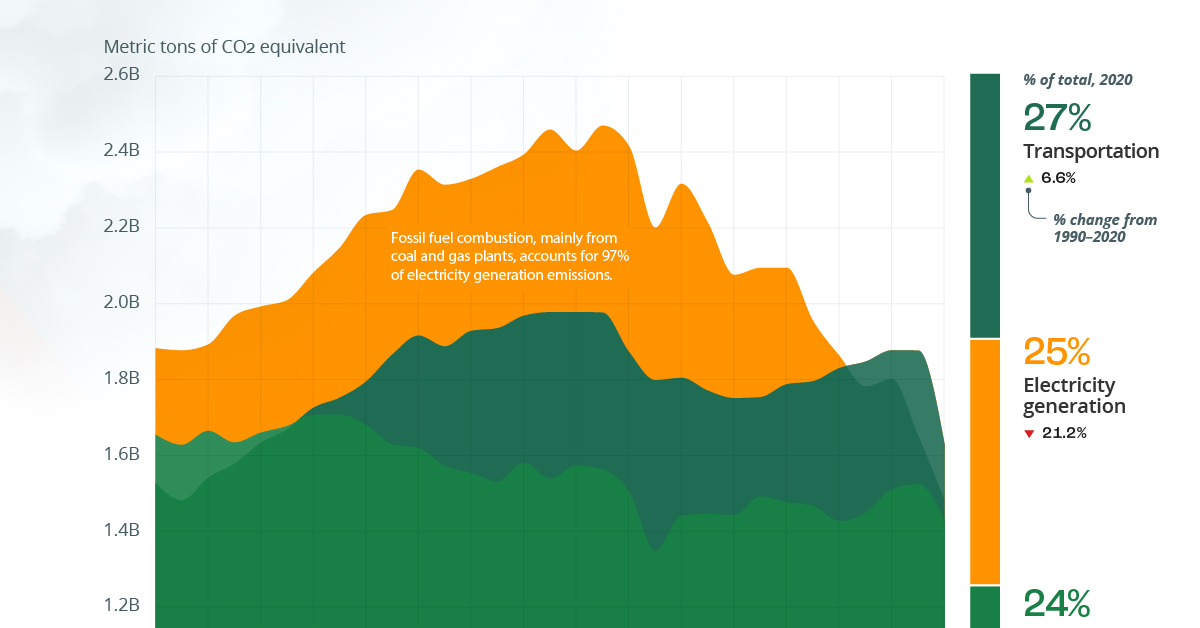
| Transportation | 1,627.6 | 27% |
| Electricity generation | 1,482.6 | 25% |
| Industry | 1,426.2 | 24% |
| Agriculture | 635.1 | 11% |
| Commercial | 425.3 | 7% |
| Residential | 362.0 | 6% |
| U.S. territories | 23.0 | <1% |
The transportation sector ranks highest by emissions and has been notably impacted by the COVID-19 pandemic, which is still affecting travel and supply chains. This has led to whipsawing figures during the last two years.
For instance, in 2020, the transportation sector’s emissions fell 15%, the steepest fall of any sector. But the largest increase in emissions in 2021 also came from transportation, which is largely credited to the economic and tourism recovery last year.
Following transportation, electricity generation accounted for a quarter of U.S. GHG emissions in 2020, with fossil fuel combustion making up nearly 99% of the sector’s emissions. The other 1% includes waste incineration and other power generation technologies like renewables and nuclear power, which produce emissions during the initial stages of raw material extraction and construction.
Decarbonizing the Power Sector
The Biden Administration has set a goal to make the U.S. power grid run on 100% clean energy by 2035—a key factor in achieving the country’s goal of net zero emissions by 2050.
Industrial factories, commercial buildings, and homes all consume electricity to power their machinery and appliances. Therefore, the power sector can help reduce their carbon footprint by supplying more clean electricity, although this largely depends on the availability of infrastructure for transmission.
Here’s how sectors would look if their respective electricity end-use is taken into account
| Sector | Emissions by Sector % of Total |
|---|---|
| Agriculture | 11% |
| Transportation | 27% |
| Industry | 30% |
| Residential & Commercial | 30% |
Percentages may not add up to 100% due to independent rounding
With these adjustments, the industrial, commercial, and residential sectors experience a notable jump, and lead ahead of other categories
Today, the bulk of electricity generation, 60%, comes from natural gas and coal-fired power plants, with nuclear, renewables, and other sources making up 40% of the total.
| Energy Source | 2020 Electric generation, billion kWh | Share of total |
|---|---|---|
| Natural Gas | 1,575 | 38.3% |
| Coal | 899 | 21.8% |
| Nuclear | 778 | 18.9% |
| Wind | 380 | 9.2% |
| Hydropower | 260 | 6.3% |
However, progress and notable strides have been made towards sustainable energy. In 2021, renewables accounted for one-fifth of U.S. electricity generation, roughly doubling their share since 2010.
Coal’s share as a source of electric power has dropped dramatically in recent years. And partially as a result, electricity generation has seen its portion of emissions successfully decrease by 21% , with overall emissions falling from 1,880 million metric tons of CO2 to 1,482 million metric tons.
How Utilities Can Lead the Way
Should these trends persist, the electricity generation sector has a chance to play a pivotal role in the broader decarbonization initiative. And with the bulk of electricity generation in the U.S. coming from investor-owned utilities (IOUs), this is a unique opportunity for IOUs to lead the transition toward cleaner energy.
The National Public Utilities Council is the go-to resource to learn how utilities can lead in the path towards decarbonization.

-

 Lithium4 days ago
Ranked: The Top 10 EV Battery Manufacturers in 2023
Asia dominates this ranking of the world’s largest EV battery manufacturers in 2023.
-

 Energy1 week ago
The World’s Biggest Nuclear Energy Producers
China has grown its nuclear capacity over the last decade, now ranking second on the list of top nuclear energy producers.
-

 Energy1 month ago
The World’s Biggest Oil Producers in 2023
Just three countries accounted for 40% of global oil production last year.
-

 Energy1 month ago
How Much Does the U.S. Depend on Russian Uranium?
Currently, Russia is the largest foreign supplier of nuclear power fuel to the U.S.
-

 Uranium2 months ago
Charted: Global Uranium Reserves, by Country
We visualize the distribution of the world’s uranium reserves by country, with 3 countries accounting for more than half of total reserves.
-

 Energy3 months ago
Visualizing the Rise of the U.S. as Top Crude Oil Producer
Over the last decade, the United States has established itself as the world’s top producer of crude oil, surpassing Saudi Arabia and Russia.