

Ten materials, including cobalt, lithium, graphite, and rare earths, are deemed critical by all three.
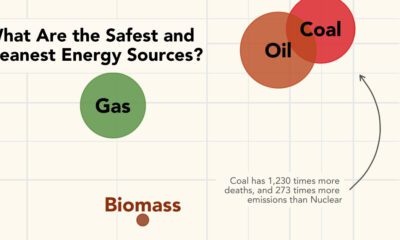

What are the safest energy sources? This graphic shows both GHG emissions and accidental deaths caused by different energy sources.
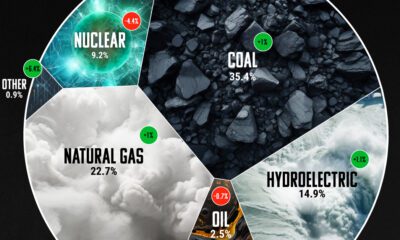

Coal still leads the charge when it comes to electricity, representing 35% of global power generation.


Mining represents 7% of British Columbia's GDP despite only accounting for 0.04% of the land use.
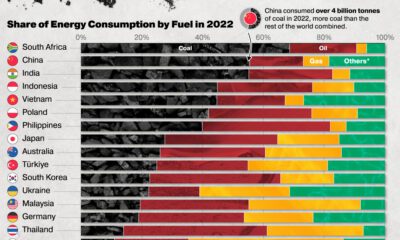

Global consumption of coal surpassed 8 billion tonnes per year for the first time in 2022. Here are the countries using the most coal.


With Russia’s revenues from fossil fuel exports having declined significantly, which countries are still importing Russian fossil fuels?
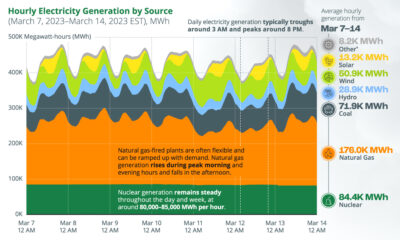

This chart tracks U.S. hourly electricity generation over one week, with various sources producing electricity at different times of the day.

Despite the advent of renewable sources of energy, fossil fuels and their carbon emissions, haven’t gone anywhere.


Asia is on its way to account for half of the world’s electricity generation by 2025. How is this growing demand currently being met?


While Russia still makes billions from fossil fuel exports, revenues are declining. Here are the largest importers since the start of the invasion.


 Creator Program