Mining
The Critical Minerals to China, EU, and U.S. National Security
![]() Subscribe to the Elements free mailing list for more like this
Subscribe to the Elements free mailing list for more like this
The Critical Minerals to China, EU, and U.S. Security
This was originally posted on Elements. Sign up to the free mailing list to get beautiful visualizations on natural resource megatrends in your email every week.
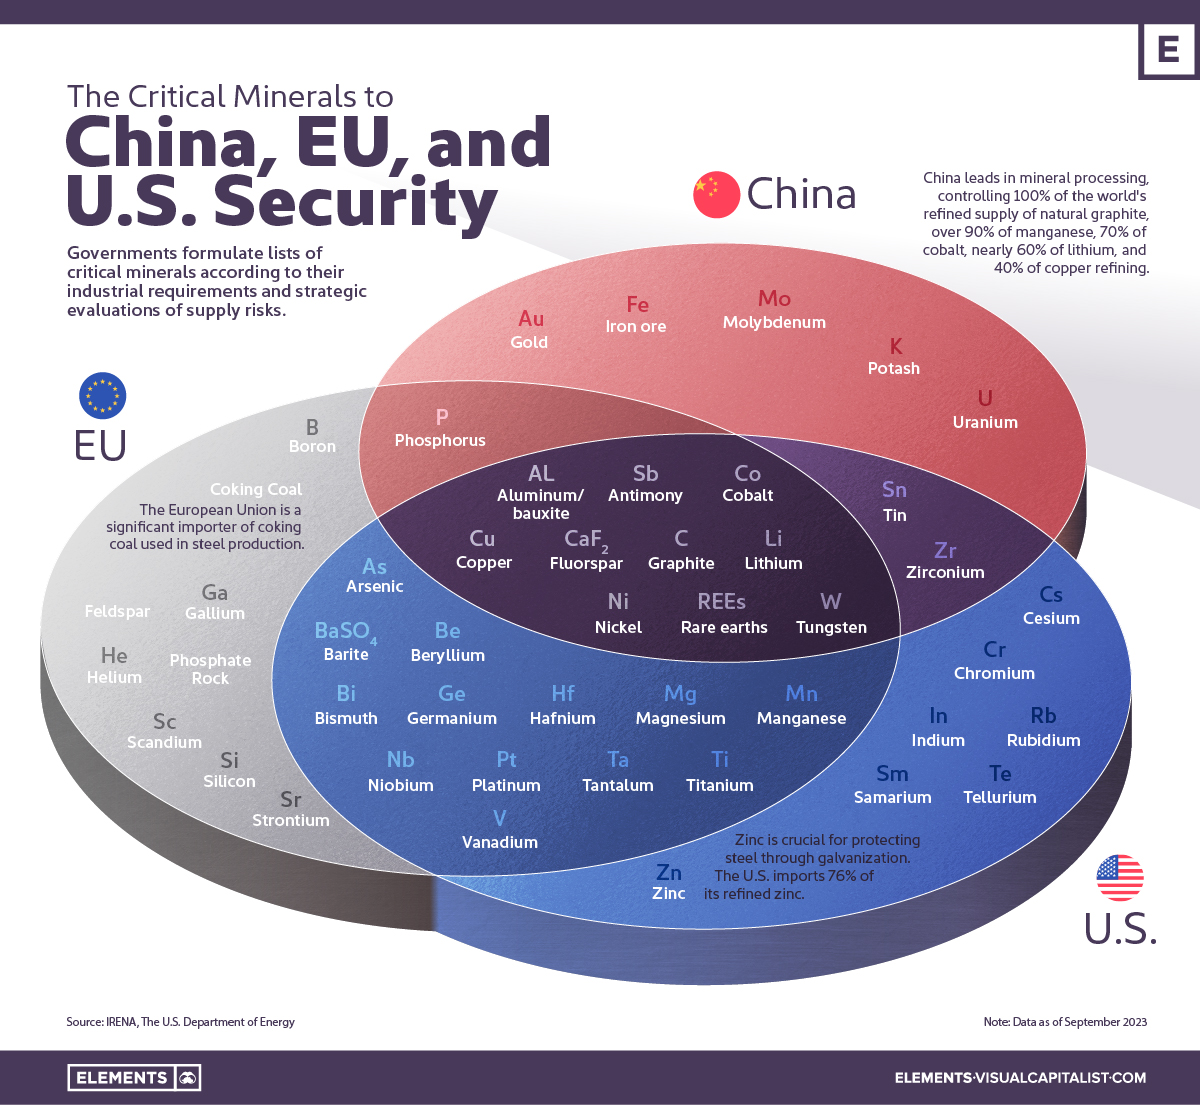
Governments formulate lists of critical minerals according to their industrial requirements and strategic evaluations of supply risks.
Over the last decade, minerals like nickel, copper, and lithium have been on these lists and deemed essential for clean technologies like EV batteries and solar and wind power.
This graphic uses IRENA and the U.S. Department of Energy data to identify which minerals are essential to China, the United States, and the European Union.
What are Critical Minerals?
There is no universally accepted definition of critical minerals. Countries and regions maintain lists that mirror current technology requirements and supply and demand dynamics, among other factors.
These lists are also constantly changing. For example, the EU’s first critical minerals list in 2011 featured only 14 raw materials. In contrast, the 2023 version identified 34 raw materials as critical.
One thing countries share, however, is the concern that a lack of minerals could slow down the energy transition.
With most countries committed to reducing greenhouse gas emissions, the total mineral demand from clean energy technologies is expected to double by 2040.
U.S. and EU Seek to Reduce Import Reliance on Critical Minerals
Ten materials feature on critical material lists of both the U.S., the EU, and China, including cobalt, lithium, graphite, and rare earths.
| Mineral / Considered Critical | 🇺🇸 U.S. | 🇪🇺 EU | 🇨🇳 China |
|---|---|---|---|
| Aluminum/ bauxite | Yes | Yes | Yes |
| Antimony | Yes | Yes | Yes |
| Cobalt | Yes | Yes | Yes |
| Copper | Yes | Yes | Yes |
| Fluorspar | Yes | Yes | Yes |
| Graphite | Yes | Yes | Yes |
| Lithium | Yes | Yes | Yes |
| Nickel | Yes | Yes | Yes |
| Rare earths | Yes | Yes | Yes |
| Tungsten | Yes | Yes | Yes |
| Arsenic | Yes | Yes | No |
| Barite | Yes | Yes | No |
| Beryllium | Yes | Yes | No |
| Bismuth | Yes | Yes | No |
| Germanium | Yes | Yes | No |
| Hafnium | Yes | Yes | No |
| Magnesium | Yes | Yes | No |
| Manganese | Yes | Yes | No |
| Niobium | Yes | Yes | No |
| Platinum | Yes | Yes | No |
| Tantalum | Yes | Yes | No |
| Titanium | Yes | Yes | No |
| Vanadium | Yes | Yes | No |
| Tin | Yes | No | Yes |
| Zirconium | Yes | No | Yes |
| Phosphorus | No | Yes | Yes |
| Cesium | Yes | No | No |
| Chromium | Yes | No | No |
| Indium | Yes | No | No |
| Rubidium | Yes | No | No |
| Samarium | Yes | No | No |
| Tellurium | Yes | No | No |
| Zinc | Yes | No | No |
| Boron | No | Yes | No |
| Coking Coal | No | Yes | No |
| Feldspar | No | Yes | No |
| Gallium | No | Yes | No |
| Helium | No | Yes | No |
| Phosphate Rock | No | Yes | No |
| Scandium | No | Yes | No |
| Silicon | No | Yes | No |
| Strontium | No | Yes | No |
| Gold | No | No | Yes |
| Iron ore | No | No | Yes |
| Molybdenum | No | No | Yes |
| Potash | No | No | Yes |
| Uranium | No | No | Yes |
Despite having most of the same materials found in the U.S. or China’s list, the European list is the only one to include phosphate rock. The region has limited phosphate resources (only produced in Finland) and largely depends on imports of the material essential for manufacturing fertilizers.
Coking coal is also only on the EU list. The material is used in the manufacture of pig iron and steel. Production is currently dominated by China (58%), followed by Australia (17%), Russia (7%), and the U.S. (7%).
The U.S. has also sought to reduce its reliance on imports. Today, the country is 100% import-dependent on manganese and graphite and 76% on cobalt.
After decades of sourcing materials from other countries, the U.S. local production of raw materials has become extremely limited. For instance, there is only one operating nickel mine (primary) in the country, the Eagle Mine in Michigan. Likewise, the country only hosts one lithium source in Nevada, the Silver Peak Mine.
China’s Dominance
Despite being the world’s biggest carbon polluter, China is the largest producer of most of the world’s critical minerals for the green revolution.
China produces 60% of all rare earth elements used as components in high-technology devices, including smartphones and computers. The country also has a 13% share of the lithium production market. In addition, it refines around 35% of the world’s nickel, 58% of lithium, and 70% of cobalt.
Among some of the unique materials on China’s list is gold. Although gold is used on a smaller scale in technology, China has sought gold for economic and geopolitical factors, mainly to diversify its foreign exchange reserves, which rely heavily on the U.S. dollar.
Analysts estimate China has bought a record 400 tonnes of gold in recent years.
China has also slated uranium as a critical mineral. The Chinese government has stated it intends to become self-sufficient in nuclear power plant capacity and fuel production for those plants.
According to the World Nuclear Association, China aims to produce one-third of its uranium domestically.


Lithium
Ranked: The Top 10 EV Battery Manufacturers in 2023
Asia dominates this ranking of the world’s largest EV battery manufacturers in 2023.


The Top 10 EV Battery Manufacturers in 2023
This was originally posted on our Voronoi app. Download the app for free on iOS or Android and discover incredible data-driven charts from a variety of trusted sources.
Despite efforts from the U.S. and EU to secure local domestic supply, all major EV battery manufacturers remain based in Asia.
In this graphic we rank the top 10 EV battery manufacturers by total battery deployment (measured in megawatt-hours) in 2023. The data is from EV Volumes.
Chinese Dominance
Contemporary Amperex Technology Co. Limited (CATL) has swiftly risen in less than a decade to claim the title of the largest global battery group.
The Chinese company now has a 34% share of the market and supplies batteries to a range of made-in-China vehicles, including the Tesla Model Y, SAIC’s MG4/Mulan, and various Li Auto models.
| Company | Country | 2023 Production (megawatt-hour) | Share of Total Production |
|---|---|---|---|
| CATL | 🇨🇳 China | 242,700 | 34% |
| BYD | 🇨🇳 China | 115,917 | 16% |
| LG Energy Solution | 🇰🇷 Korea | 108,487 | 15% |
| Panasonic | 🇯🇵 Japan | 56,560 | 8% |
| SK On | 🇰🇷 Korea | 40,711 | 6% |
| Samsung SDI | 🇰🇷 Korea | 35,703 | 5% |
| CALB | 🇨🇳 China | 23,493 | 3% |
| Farasis Energy | 🇨🇳 China | 16,527 | 2% |
| Envision AESC | 🇨🇳 China | 8,342 | 1% |
| Sunwoda | 🇨🇳 China | 6,979 | 1% |
| Other | - | 56,040 | 8% |
In 2023, BYD surpassed LG Energy Solution to claim second place. This was driven by demand from its own models and growth in third-party deals, including providing batteries for the made-in-Germany Tesla Model Y, Toyota bZ3, Changan UNI-V, Venucia V-Online, as well as several Haval and FAW models.
The top three battery makers (CATL, BYD, LG) collectively account for two-thirds (66%) of total battery deployment.
Once a leader in the EV battery business, Panasonic now holds the fourth position with an 8% market share, down from 9% last year. With its main client, Tesla, now sourcing batteries from multiple suppliers, the Japanese battery maker seems to be losing its competitive edge in the industry.
Overall, the global EV battery market size is projected to grow from $49 billion in 2022 to $98 billion by 2029, according to Fortune Business Insights.

-

 Education1 week ago
How Hard Is It to Get Into an Ivy League School?
-

 Technology2 weeks ago
Ranked: Semiconductor Companies by Industry Revenue Share
-

 Markets2 weeks ago
Ranked: The World’s Top Flight Routes, by Revenue
-

 Demographics2 weeks ago
Population Projections: The World’s 6 Largest Countries in 2075
-

 Markets2 weeks ago
The Top 10 States by Real GDP Growth in 2023
-

 Demographics2 weeks ago
The Smallest Gender Wage Gaps in OECD Countries
-

 Economy2 weeks ago
Where U.S. Inflation Hit the Hardest in March 2024
-

 Environment2 weeks ago
Top Countries By Forest Growth Since 2001