Mining
All the Metals We Mined in One Visualization
![]() Subscribe to the Elements free mailing list for more like this
Subscribe to the Elements free mailing list for more like this
All the Metals We Mined in One Visualization
This was originally posted on Elements. Sign up to the free mailing list to get beautiful visualizations on natural resource megatrends in your email every week.
Metals are a big part of our daily lives, found in every building we enter and all devices we use.
Today, major industries that directly consume processed mineral materials contribute 14% of the United States economy.
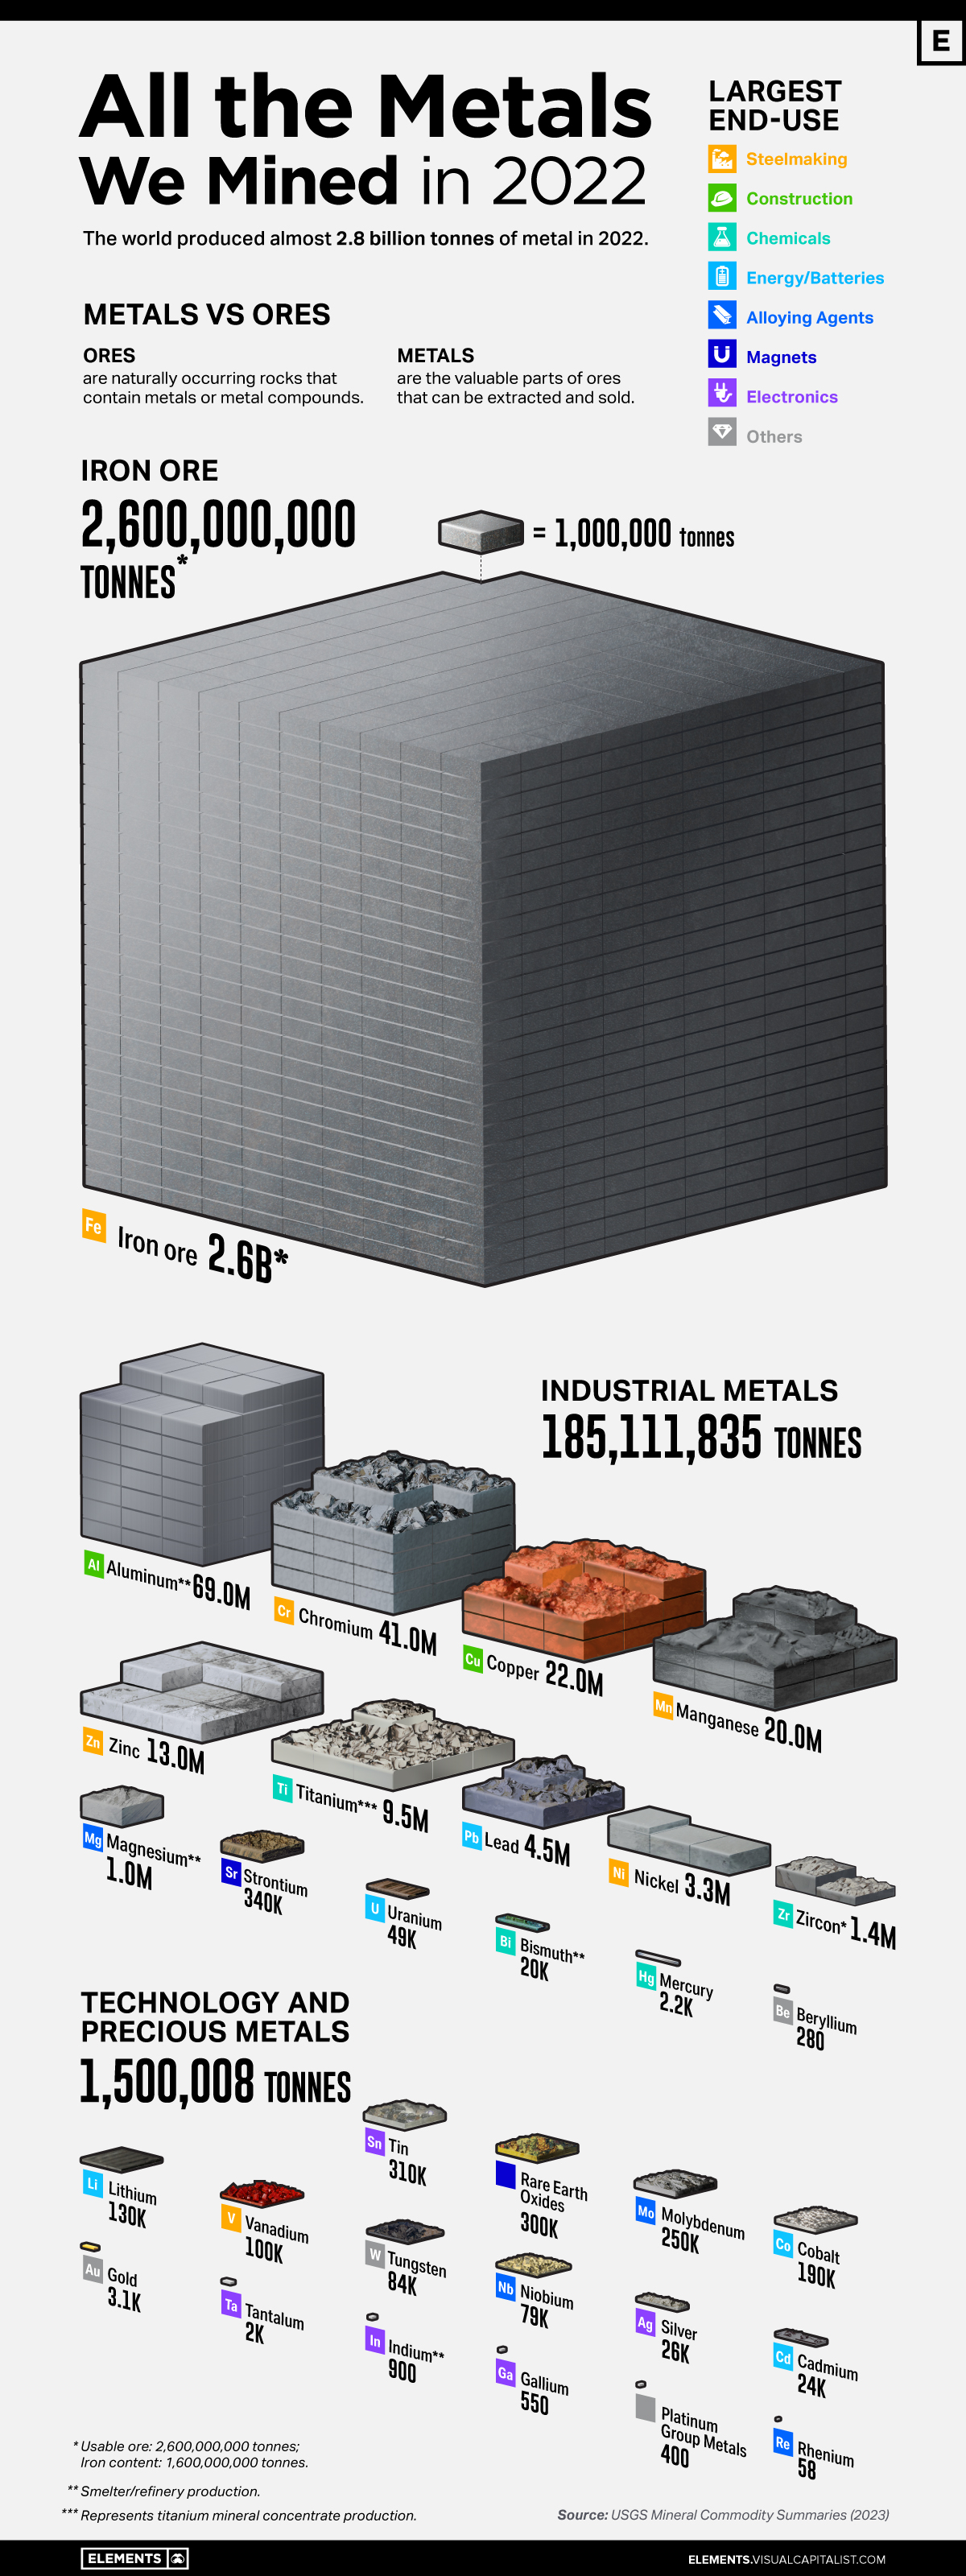
The above infographic visualizes all 2.8 billion tonnes of metals mined in 2022 and highlights each metal’s largest end-use using data from the United States Geological Survey (USGS).
Iron Ore Dominance
Iron ore dominates the metals mining landscape, comprising 93% of the total mined. In 2022, 2.6 billion tonnes of iron ore were mined, containing about 1.6 billion tonnes of iron.
| Metal/Ore | Quantity Mined in 2022 (tonnes) | % of Total |
|---|---|---|
| Iron ore | 2,600,000,000 | 93.3% |
| Industrial metals | 185,111,835 | 6.6% |
| Technology and Precious Metals | 1,500,008 | 0.05% |
| Total | 2,786,611,843 | 100% |
Percentages may not add up to 100 due to rounding.
Iron ores are found in various geologic environments, such as igneous, metamorphic, or sedimentary rocks, and can contain over 70% iron, with many falling in the 50-60% range.
Combined with other materials like coke and limestone, iron ore is primarily used in steel production. Today, almost all (98%) iron ore is dedicated to steelmaking.
The ore is typically mined in about 50 countries, but Australia, Brazil, China, and India are responsible for 75% of the production.
Because of its essential role in infrastructure development, iron ore is one of the most crucial materials underpinning urbanization and economic growth.
Industrial Metals
Industrial metals occupy the second position on our list, constituting 6.6% of all metals mined in 2022. These metals, including copper, aluminum, lead, and zinc, are employed in construction and industrial applications.
Aluminum constituted nearly 40% of industrial metal production in 2022. China was responsible for 56% of all aluminum produced.
| Industrial Metals | 2022 Mine Production (tonnes) | % of Total |
|---|---|---|
| Aluminum | 69,000,000 | 37.3% |
| Chromium | 41,000,000 | 22.1% |
| Copper | 22,000,000 | 11.9% |
| Manganese | 20,000,000 | 10.8% |
| Zinc | 13,000,000 | 7.0% |
| Titanium (mineral concentrates) | 9,500,000 | 5.1% |
| Lead | 4,500,000 | 2.4% |
| Nickel | 3,300,000 | 1.8% |
| Zirconium Minerals (Zircon) | 1,400,000 | 0.8% |
| Magnesium | 1,000,000 | 0.5% |
| Strontium | 340,000 | 0.2% |
| Uranium | 49,355 | 0.03% |
| Bismuth | 20,000 | 0.01% |
| Mercury | 2,200 | 0.00% |
| Beryllium | 280 | 0.00% |
| Total | 185,111,835 | 100.00% |
In the second position is chromium, which plays a primary role in rendering stainless steel corrosion-resistant. South Africa led chromium production, accounting for 44% of the total mined last year.
Technology and Precious Metals
Despite representing less than 1% of all the metals mined, technology metals have been on the news over the last few years as countries and companies seek these materials to reduce carbon emissions and improve productivity.
| Technology and Precious Metals | 2022 Mine Production (tonnes) | % of Total |
|---|---|---|
| Tin | 310,000 | 20.7% |
| Rare Earth Oxides | 300,000 | 20.0% |
| Molybdenum | 250,000 | 16.7% |
| Cobalt | 190,000 | 12.7% |
| Lithium | 130,000 | 8.7% |
| Vanadium | 100,000 | 6.7% |
| Tungsten | 84,000 | 5.6% |
| Niobium | 79,000 | 5.3% |
| Silver | 26,000 | 1.7% |
| Cadmium | 24,000 | 1.6% |
| Gold | 3,100 | 0.2% |
| Tantalum | 2,000 | 0.1% |
| Indium | 900 | 0.1% |
| Gallium | 550 | 0.04% |
| Platinum Group Metals | 400 | 0.03% |
| Rhenium | 58 | 0.004% |
| Total | 1,500,008 | 100% |
They include lithium and cobalt, used in electric vehicles and battery storage, and rare earths, used in magnets, metal alloys, and electronics. Many of them are considered critical for countries’ security due to their role in clean energy technologies and dependency on other nations to supply domestic demand.
However, despite increasing interest in these metals, they are still behind precious metals such as gold and silver regarding market size.
The gold market, for example, reached $196 billion in 2022, compared to $10.6 billion of the rare earth market.


Lithium
Ranked: The Top 10 EV Battery Manufacturers in 2023
Asia dominates this ranking of the world’s largest EV battery manufacturers in 2023.


The Top 10 EV Battery Manufacturers in 2023
This was originally posted on our Voronoi app. Download the app for free on iOS or Android and discover incredible data-driven charts from a variety of trusted sources.
Despite efforts from the U.S. and EU to secure local domestic supply, all major EV battery manufacturers remain based in Asia.
In this graphic we rank the top 10 EV battery manufacturers by total battery deployment (measured in megawatt-hours) in 2023. The data is from EV Volumes.
Chinese Dominance
Contemporary Amperex Technology Co. Limited (CATL) has swiftly risen in less than a decade to claim the title of the largest global battery group.
The Chinese company now has a 34% share of the market and supplies batteries to a range of made-in-China vehicles, including the Tesla Model Y, SAIC’s MG4/Mulan, and various Li Auto models.
| Company | Country | 2023 Production (megawatt-hour) | Share of Total Production |
|---|---|---|---|
| CATL | 🇨🇳 China | 242,700 | 34% |
| BYD | 🇨🇳 China | 115,917 | 16% |
| LG Energy Solution | 🇰🇷 Korea | 108,487 | 15% |
| Panasonic | 🇯🇵 Japan | 56,560 | 8% |
| SK On | 🇰🇷 Korea | 40,711 | 6% |
| Samsung SDI | 🇰🇷 Korea | 35,703 | 5% |
| CALB | 🇨🇳 China | 23,493 | 3% |
| Farasis Energy | 🇨🇳 China | 16,527 | 2% |
| Envision AESC | 🇨🇳 China | 8,342 | 1% |
| Sunwoda | 🇨🇳 China | 6,979 | 1% |
| Other | - | 56,040 | 8% |
In 2023, BYD surpassed LG Energy Solution to claim second place. This was driven by demand from its own models and growth in third-party deals, including providing batteries for the made-in-Germany Tesla Model Y, Toyota bZ3, Changan UNI-V, Venucia V-Online, as well as several Haval and FAW models.
The top three battery makers (CATL, BYD, LG) collectively account for two-thirds (66%) of total battery deployment.
Once a leader in the EV battery business, Panasonic now holds the fourth position with an 8% market share, down from 9% last year. With its main client, Tesla, now sourcing batteries from multiple suppliers, the Japanese battery maker seems to be losing its competitive edge in the industry.
Overall, the global EV battery market size is projected to grow from $49 billion in 2022 to $98 billion by 2029, according to Fortune Business Insights.

-

 Education1 week ago
How Hard Is It to Get Into an Ivy League School?
-

 Technology2 weeks ago
Ranked: Semiconductor Companies by Industry Revenue Share
-

 Markets2 weeks ago
Ranked: The World’s Top Flight Routes, by Revenue
-

 Demographics2 weeks ago
Population Projections: The World’s 6 Largest Countries in 2075
-

 Markets2 weeks ago
The Top 10 States by Real GDP Growth in 2023
-

 Demographics2 weeks ago
The Smallest Gender Wage Gaps in OECD Countries
-

 Economy2 weeks ago
Where U.S. Inflation Hit the Hardest in March 2024
-

 Environment2 weeks ago
Top Countries By Forest Growth Since 2001