Politics
How Do Democrats and Republicans Feel About Certain U.S. Industries?
![]() See this visualization first on the Voronoi app.
See this visualization first on the Voronoi app.
Industry Favorability, by Political Party
This was originally posted on our Voronoi app. Download the app for free on iOS or Android and discover incredible data-driven charts from a variety of trusted sources.
Much and more has been written, in the last decade particularly, about the U.S. political sphere becoming increasingly polarized. The two main parties—Democrats and Republicans—have clashed over how to run the economy, as well as on key social issues.
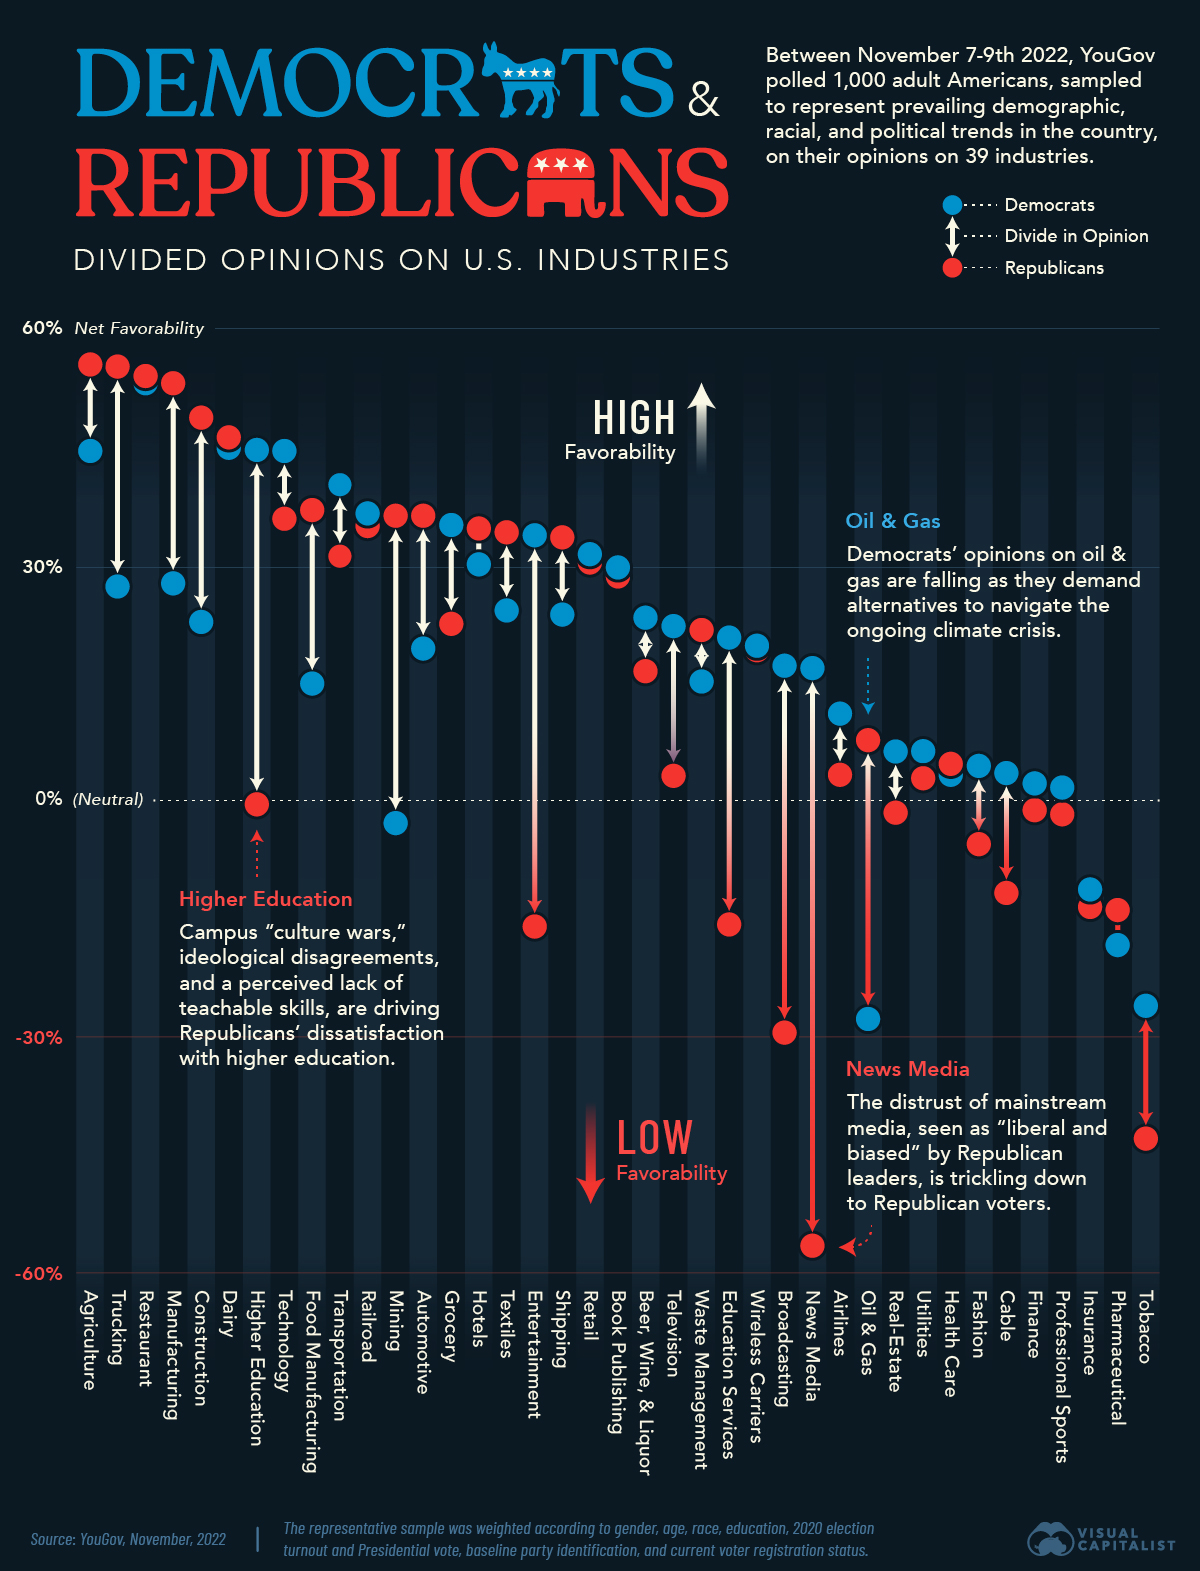
Perhaps unsurprisingly then, Democrat and Republican voters are also divided on various U.S. industries, per a YouGov poll conducted in 2022.
Between November 7-9th of that year, the market research firm polled 1,000 adult Americans, (sampled to represent prevailing demographic, racial, and political-party-affiliation trends in the country) on their opinions on 39 industries. They asked:
“Generally speaking, do you have a favorable or unfavorable opinion of the following industry?” — YouGov Poll.
In this chart we visualize the percentage with a favorable view of an industry minus those with unfavorable view, categorized by current voter status.
A higher percentage means more Democrats or Republicans rated the industry as favorable, and vice-versa. Negative percentages mean more respondents responded unfavorably.
Democrats vs. Republicans on Industry Favorability
From a glance, it’s immediately noticeable that quite a few industries have divided Democrats and Republics quite severely.
For example, of the sampled Democrats, a net 45%, found Higher Education “favorable.” This is compared to 0% on the Republican side, which means an equal number found the industry favorable and unfavorable.
Here’s the full list of net favorable responses from Democrats and Republicans per industry.
| Industry | Democrat Net Favorability | Republican Net Favorability |
|---|---|---|
| Agriculture | 44% | 55% |
| Trucking | 27% | 55% |
| Restaurant | 53% | 54% |
| Manufacturing | 27% | 53% |
| Construction | 23% | 49% |
| Dairy | 45% | 46% |
| Higher education | 45% | 0% |
| Technology | 44% | 36% |
| Food manufacturing | 15% | 37% |
| Transportation | 27% | 37% |
| Railroad | 37% | 35% |
| Mining | -3% | 36% |
| Automotive | 19% | 36% |
| Grocery | 35% | 22% |
| Hotels | 30% | 35% |
| Textiles | 24% | 34% |
| Entertainment | 34% | -17% |
| Shipping | 24% | 33% |
| Retail | 31% | 31% |
| Book publishing | 30% | 29% |
| Alcohol | 23% | 16% |
| Television | 22% | 3% |
| Waste management | 15% | 22% |
| Education services | 21% | -16% |
| Wireless carriers | 19% | 19% |
| Broadcasting | 17% | -30% |
| News media | 17% | -57% |
| Airlines | 11% | 3% |
| Oil and gas | -28% | 7% |
| Real-estate | -2% | 6% |
| Utilities | 2% | 6% |
| Health care | 3% | 4% |
| Fashion | 4% | -6% |
| Cable | -12% | 3% |
| Finance | 2% | -2% |
| Professional sports | 1% | -2% |
| Insurance | -12% | -14% |
| Pharmaceutical | -18% | -14% |
| Tobacco | -44% | -27% |
The other few immediately noticeable disparities in favorability include:
- Mining and Oil and Gas, (more Republicans in favor),
- Entertainment, Education Services, and News Media (more Democrats in favor).
Tellingly, the larger social and political concerns at play are influencing Democrat and Republican opinions about these parts of the economy.
For example Pew Research pointed out Republicans are dissatisfied with universities for a number of reasons: worries about constraints on free speech, campus “culture wars,” and professors bringing their politics into the classroom.
In contrast, Democrats’ criticisms of higher education revolved around tuition costs and the quality of education offered.
On a more recent note, Citadel CEO Ken Griffin, a big Harvard donor, pulled funding after criticizing universities for educating “whiny snowflakes.” In October, donors to the University of Pennsylvania withdrew their support, upset with the university’s response to the October 7th attacks and subsequent war in Gaza.
Meanwhile, the reasons for differences over media favorability are more obvious. Commentators say being “anti-media” is now part of the larger Republican leadership identity, and in turn, is trickling down to their voters. Pew Research also found that Republicans are less likely to trust the news if it comes from a “mainstream” source.
But these are industries that are already adjacent to the larger political sphere. What about the others?
U.S. Politics and the Climate Crisis
The disparity over how the Oil & Gas and Mining industries are viewed is a reflection, again, of American politics and the partisan divide around the climate crisis and whether there’s a noticeable impact from human activity.
Both industries contribute heavily to carbon emissions, and Democrat lawmakers have previously urged the Biden transition to start planning for the end of fossil-fuel reliance.
Meanwhile, former President Trump, for example, has previously called global warming “a hoax” but later reversed course, clarifying that he didn’t know if it was “man-made.”
When removing the climate context, and related environmental degradation, both industries usually pay high wages and produce materials critical to many other parts of the economy, including the strategic metals needed for the energy transition.


Economy
The Bloc Effect: International Trade with Geopolitical Allies on the Rise
Rising geopolitical tensions are shaping the future of international trade, but what is the effect on trading among G7 and BRICS countries?


The Bloc Effect: International Trade with Allies on the Rise
International trade has become increasingly fragmented over the last five years as countries have shifted to trading more with their geopolitical allies.
This graphic from The Hinrich Foundation, the first in a three-part series covering the future of trade, provides visual context to the growing divide in trade in G7 and pre-expansion BRICS countries, which are used as proxies for geopolitical blocs.
Trade Shifts in G7 and BRICS Countries
This analysis uses IMF data to examine differences in shares of exports within and between trading blocs from 2018 to 2023. For example, we looked at the percentage of China’s exports with other BRICS members as well as with G7 members to see how these proportions shifted in percentage points (pp) over time.
Countries traded nearly $270 billion more with allies in 2023 compared to 2018. This shift came at the expense of trade with rival blocs, which saw a decline of $314 billion.
Country Change in Exports Within Bloc (pp) Change in Exports With Other Bloc (pp)
🇮🇳 India 0.0 3.9
🇷🇺 Russia 0.7 -3.8
🇮🇹 Italy 0.8 -0.7
🇨🇦 Canada 0.9 -0.7
🇫🇷 France 1.0 -1.1
🇪🇺 EU 1.1 -1.5
🇩🇪 Germany 1.4 -2.1
🇿🇦 South Africa 1.5 1.5
🇺🇸 U.S. 1.6 -0.4
🇯🇵 Japan 2.0 -1.7
🇨🇳 China 2.1 -5.2
🇧🇷 Brazil 3.7 -3.3
🇬🇧 UK 10.2 0.5
All shifts reported are in percentage points. For example, the EU saw its share of exports to G7 countries rise from 74.3% in 2018 to 75.4% in 2023, which equates to a 1.1 percentage point increase.
The UK saw the largest uptick in trading with other countries within the G7 (+10.2 percentage points), namely the EU, as the post-Brexit trade slump to the region recovered.
Meanwhile, the U.S.-China trade dispute caused China’s share of exports to the G7 to fall by 5.2 percentage points from 2018 to 2023, the largest decline in our sample set. In fact, partly as a result of the conflict, the U.S. has by far the highest number of harmful tariffs in place.
The Russia-Ukraine War and ensuing sanctions by the West contributed to Russia’s share of exports to the G7 falling by 3.8 percentage points over the same timeframe.
India, South Africa, and the UK bucked the trend and continued to witness advances in exports with the opposing bloc.
Average Trade Shifts of G7 and BRICS Blocs
Though results varied significantly on a country-by-country basis, the broader trend towards favoring geopolitical allies in international trade is clear.
Bloc Change in Exports Within Bloc (pp) Change in Exports With Other Bloc (pp)
Average 2.1 -1.1
BRICS 1.6 -1.4
G7 incl. EU 2.4 -1.0
Overall, BRICS countries saw a larger shift away from exports with the other bloc, while for G7 countries the shift within their own bloc was more pronounced. This implies that though BRICS countries are trading less with the G7, they are relying more on trade partners outside their bloc to make up for the lost G7 share.
A Global Shift in International Trade and Geopolitical Proximity
The movement towards strengthening trade relations based on geopolitical proximity is a global trend.
The United Nations categorizes countries along a scale of geopolitical proximity based on UN voting records.
According to the organization’s analysis, international trade between geopolitically close countries rose from the first quarter of 2022 (when Russia first invaded Ukraine) to the third quarter of 2023 by over 6%. Conversely, trade with geopolitically distant countries declined.
The second piece in this series will explore China’s gradual move away from using the U.S. dollar in trade settlements.
Visit the Hinrich Foundation to learn more about the future of geopolitical trade

-

 Economy2 days ago
Economic Growth Forecasts for G7 and BRICS Countries in 2024
The IMF has released its economic growth forecasts for 2024. How do the G7 and BRICS countries compare?
-

 United States2 weeks ago
Ranked: The Largest U.S. Corporations by Number of Employees
We visualized the top U.S. companies by employees, revealing the massive scale of retailers like Walmart, Target, and Home Depot.
-

 United States2 weeks ago
Where U.S. Inflation Hit the Hardest in March 2024
We visualized product categories that saw the highest % increase in price due to U.S. inflation as of March 2024.
-

 Economy1 month ago
G20 Inflation Rates: Feb 2024 vs COVID Peak
We visualize inflation rates across G20 countries as of Feb 2024, in the context of their COVID-19 pandemic peak.
-

 Jobs1 month ago
Mapped: Unemployment Claims by State
This visual heatmap of unemployment claims by state highlights New York, California, and Alaska leading the country by a wide margin.
-

 Markets2 months ago
Confidence in the Global Economy, by Country
Will the global economy be stronger in 2024 than in 2023?

-

 Misc1 week ago
How Hard Is It to Get Into an Ivy League School?
-

 Technology2 weeks ago
Ranked: Semiconductor Companies by Industry Revenue Share
-

 Markets2 weeks ago
Ranked: The World’s Top Flight Routes, by Revenue
-

 Countries2 weeks ago
Population Projections: The World’s 6 Largest Countries in 2075
-

 Markets2 weeks ago
The Top 10 States by Real GDP Growth in 2023
-

 Demographics2 weeks ago
The Smallest Gender Wage Gaps in OECD Countries
-
United States2 weeks ago
Where U.S. Inflation Hit the Hardest in March 2024
-

 Green2 weeks ago
Top Countries By Forest Growth Since 2001