

This visual breaks down just how much space debris is currently orbiting the Earth, and the nations responsible for it.


As geopolitical tensions began to heat up around the world, which nations were the top military spenders in 2021?
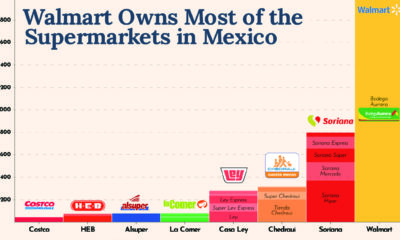

Walmart's presence in Mexico is dominant, with over 2,700 stores. How does their store count compare to companies in the region?


Which countries have the biggest militaries in the world? This map reveals all the world’s military personnel.
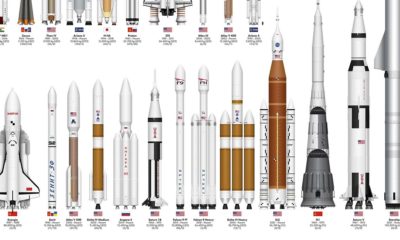

This infographic sizes up different rockets used to explore space, from the USSR's Soyuz to the SpaceX Starship.
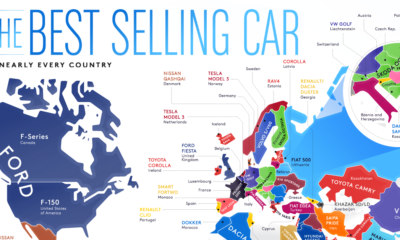

From American trucks to European sedans, this map shows the best-selling vehicles in the world.
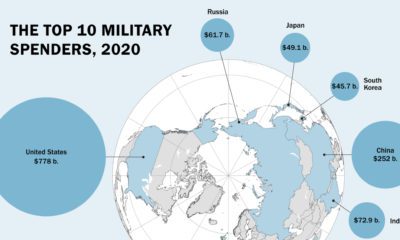

Global military spending is now at a 32-year high. We show countries' military spending by dollars and as a portion of GDP.
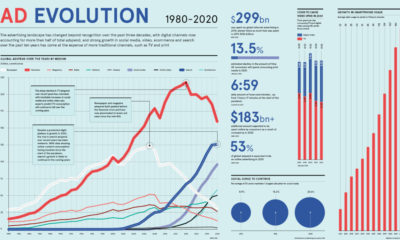

How has global advertising spending shifted over recent decades? We look at the data to see how both the industry and media have evolved.
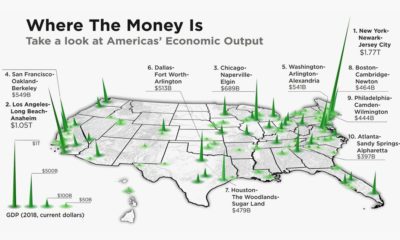

The total U.S. GDP stands at a whopping $21 trillion, but which metro areas contribute to the most in terms of economic output?


With the current supply chain of cobalt under scrutiny, companies and governments are striving to find new sources of cobalt beyond the Congo.