

In this graphic, we illustrate the top ten emerging markets according to their foreign direct investment (FDI) momentum in 2024.


The top three economic powerhouses of Africa contribute more than one-third to the African economy. We rank the nations of the world's second-largest continent by 2024...
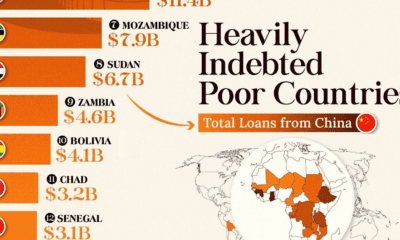

This infographic lists countries in Africa and other developing regions that received billions in loans from China.


Which economies are expected to see interest rates rise, or fall? We highlight IMF forecasts for international interest rates through 2028.

This graphic uses the latest IMF projections to rank the world's top 20 fastest growing economies for 2024.
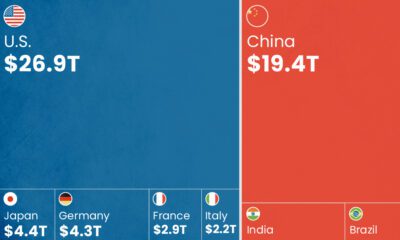

As BRICS is set to add six new countries, how does the bloc and its new members' GDP compare with that of the G7?
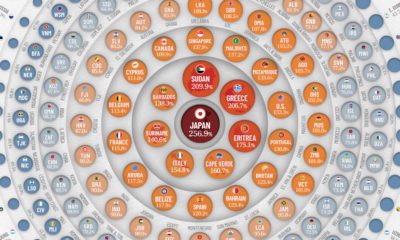

Global debt reached $226T by the end of 2020 – the biggest one-year jump since WWII. This graphic compares the debt-to-GDP ratio of various countries.
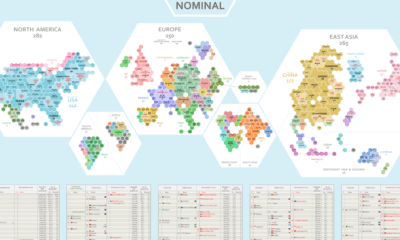

Where does the world's economic activity take place? This cartogram shows the $94 trillion global economy divided into 1,000 hexagons.
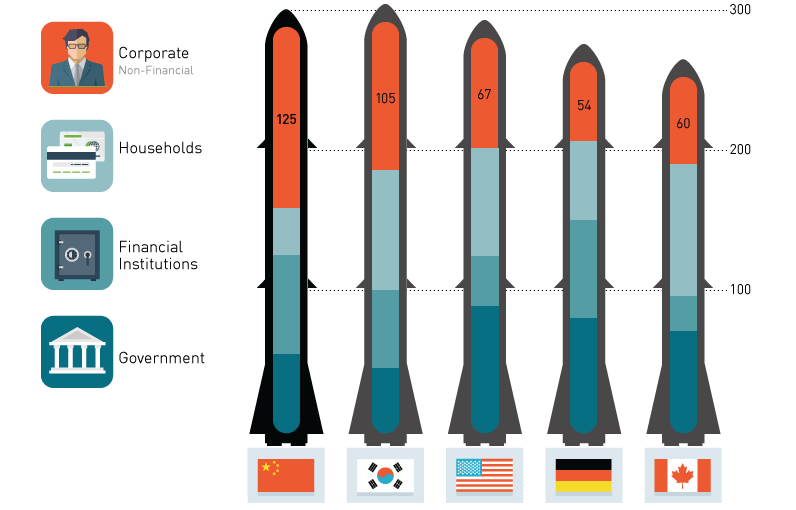
No one knows the size of China's debt bomb. Here we look at estimates of the payload as well as what could potentially ignite the fuse.
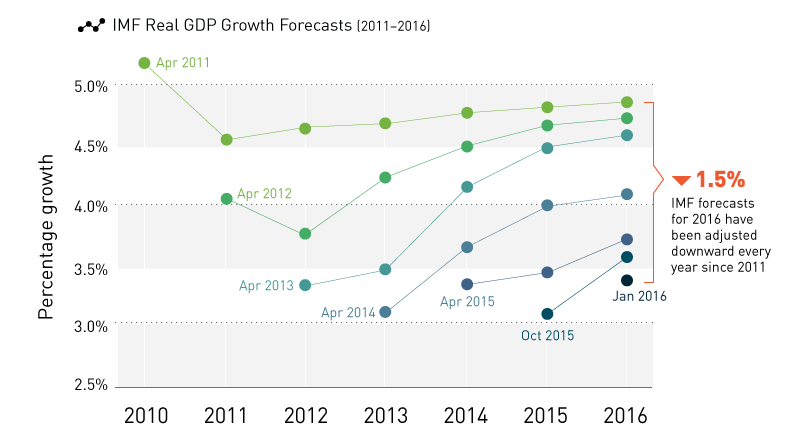
After five years of downward revisions to global real GDP growth, will next week's IMF economic report finally be grounded in reality?


