Politics
Breaking Down $1.3T in NATO Defense Spending
![]() See this visualization first on the Voronoi app.
See this visualization first on the Voronoi app.
Breaking down $1.3T in NATO Defense Spending
This was originally posted on our Voronoi app. Download the app for free on iOS or Android and discover incredible data-driven charts from a variety of trusted sources.
The North Atlantic Treaty Organization (NATO) is a political and military alliance comprising 31 countries. Its primary purpose is to facilitate cooperation among member nations, ensuring mutual defense and security.
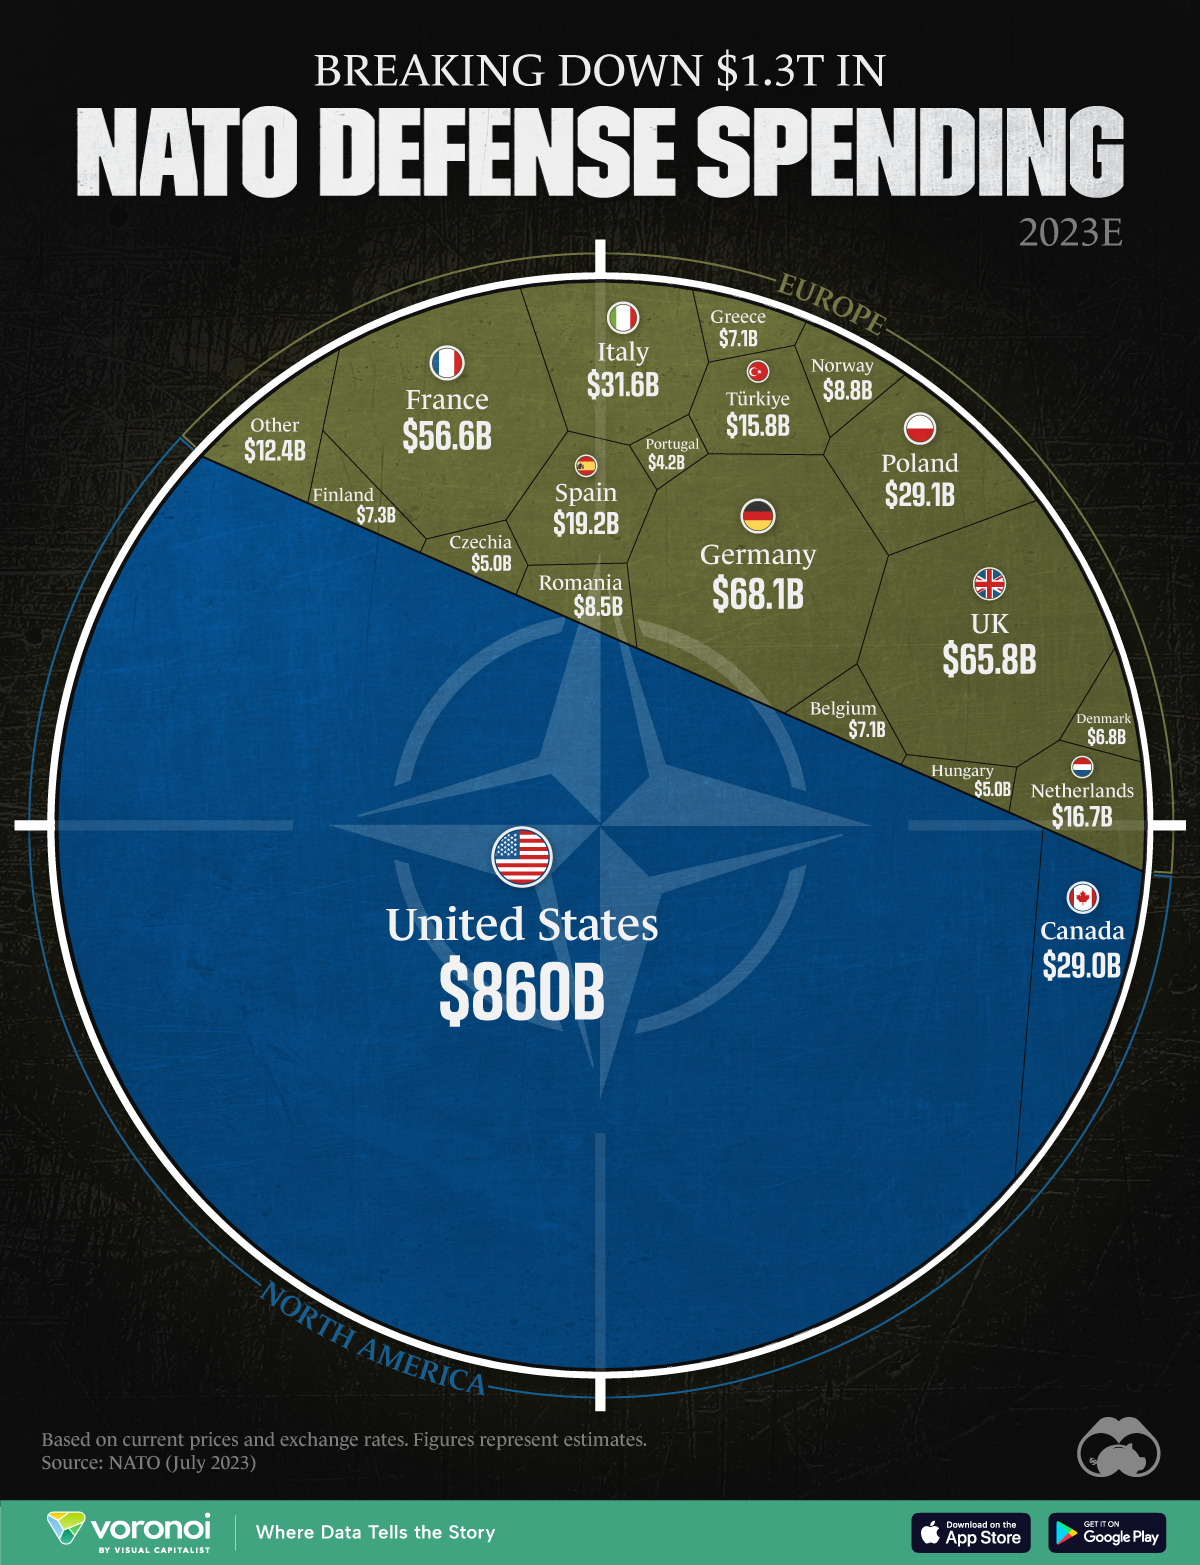
This graphic breaks down the expected defense expenditures of NATO members in 2023, using data from NATO and based on current prices and exchange rates.
U.S. Dominance of NATO’s Defense Spending
NATO defines defense expenditure as payments made by a national government, excluding regional, local, and municipal authorities, specifically to fulfill the requirements of its armed forces. It requires members to spend at least 2% of its GDP on defense.
A major component of defense expenditure includes payments for active armed forces personnel as well as retired pensioners. Expenditures for stockpiling war reserves of military equipment or supplies are also included. Additionally, it encompasses expenditures for peacekeeping and humanitarian operations, as well as the destruction of weapons.
The U.S. is by far the largest contributor to NATO’s budget. In 2023, the country accounted for $860 billion spent by the organization, representing 68% of the total expenditure. This amount is over 10 times more than that of the second-placed country, Germany.
| Country | 2023 Defense Spending (USD, Millions)* |
|---|---|
| 🇺🇸 United States | $860,000 |
| 🇩🇪 Germany | $68,080 |
| 🇬🇧 United Kingdom | $65,763 |
| 🇫🇷 France | $56,649 |
| 🇮🇹 Italy | $31,585 |
| 🇵🇱 Poland | $29,105 |
| 🇨🇦 Canada | $28,950 |
| 🇪🇸 Spain | $19,179 |
| 🇳🇱 Netherlands | $16,741 |
| 🇹🇷 Türkiye | $15,842 |
| 🇳🇴 Norway | $8,814 |
| 🇷🇴 Romania | $8,481 |
| 🇫🇮 Finland | $7,325 |
| 🇬🇷 Greece | $7,125 |
| 🇧🇪 Belgium | $7,076 |
| 🇩🇰 Denmark | $6,775 |
| 🇭🇺 Hungary | $5,036 |
| 🇨🇿 Czechia | $5,033 |
| 🇵🇹 Portugal | $4,167 |
| 🌐 Other | $12,400 |
*Expected spending in 2023, based on July 2023 data from NATO.
U.S. defense spending, within the context of NATO, aims to support European allies, deter adversaries like Russia, and gain access to additional military resources, among other objectives.
In 2018, then-President Trump sent letters to NATO allies demanding that they spend more on defense to meet the 2% minimum target. In recent years, however, the U.S. has increased its spending, experiencing a 6% jump compared to 2021.
The Future of NATO
After two years since Russia’s full-scale invasion of Ukraine, NATO has mostly maintained its unity against Moscow.
The alliance has expanded with Finland’s membership in 2023 and will likely include Sweden soon.


Economy
The Bloc Effect: International Trade with Geopolitical Allies on the Rise
Rising geopolitical tensions are shaping the future of international trade, but what is the effect on trading among G7 and BRICS countries?


The Bloc Effect: International Trade with Allies on the Rise
International trade has become increasingly fragmented over the last five years as countries have shifted to trading more with their geopolitical allies.
This graphic from The Hinrich Foundation, the first in a three-part series covering the future of trade, provides visual context to the growing divide in trade in G7 and pre-expansion BRICS countries, which are used as proxies for geopolitical blocs.
Trade Shifts in G7 and BRICS Countries
This analysis uses IMF data to examine differences in shares of exports within and between trading blocs from 2018 to 2023. For example, we looked at the percentage of China’s exports with other BRICS members as well as with G7 members to see how these proportions shifted in percentage points (pp) over time.
Countries traded nearly $270 billion more with allies in 2023 compared to 2018. This shift came at the expense of trade with rival blocs, which saw a decline of $314 billion.
Country Change in Exports Within Bloc (pp) Change in Exports With Other Bloc (pp)
🇮🇳 India 0.0 3.9
🇷🇺 Russia 0.7 -3.8
🇮🇹 Italy 0.8 -0.7
🇨🇦 Canada 0.9 -0.7
🇫🇷 France 1.0 -1.1
🇪🇺 EU 1.1 -1.5
🇩🇪 Germany 1.4 -2.1
🇿🇦 South Africa 1.5 1.5
🇺🇸 U.S. 1.6 -0.4
🇯🇵 Japan 2.0 -1.7
🇨🇳 China 2.1 -5.2
🇧🇷 Brazil 3.7 -3.3
🇬🇧 UK 10.2 0.5
All shifts reported are in percentage points. For example, the EU saw its share of exports to G7 countries rise from 74.3% in 2018 to 75.4% in 2023, which equates to a 1.1 percentage point increase.
The UK saw the largest uptick in trading with other countries within the G7 (+10.2 percentage points), namely the EU, as the post-Brexit trade slump to the region recovered.
Meanwhile, the U.S.-China trade dispute caused China’s share of exports to the G7 to fall by 5.2 percentage points from 2018 to 2023, the largest decline in our sample set. In fact, partly as a result of the conflict, the U.S. has by far the highest number of harmful tariffs in place.
The Russia-Ukraine War and ensuing sanctions by the West contributed to Russia’s share of exports to the G7 falling by 3.8 percentage points over the same timeframe.
India, South Africa, and the UK bucked the trend and continued to witness advances in exports with the opposing bloc.
Average Trade Shifts of G7 and BRICS Blocs
Though results varied significantly on a country-by-country basis, the broader trend towards favoring geopolitical allies in international trade is clear.
Bloc Change in Exports Within Bloc (pp) Change in Exports With Other Bloc (pp)
Average 2.1 -1.1
BRICS 1.6 -1.4
G7 incl. EU 2.4 -1.0
Overall, BRICS countries saw a larger shift away from exports with the other bloc, while for G7 countries the shift within their own bloc was more pronounced. This implies that though BRICS countries are trading less with the G7, they are relying more on trade partners outside their bloc to make up for the lost G7 share.
A Global Shift in International Trade and Geopolitical Proximity
The movement towards strengthening trade relations based on geopolitical proximity is a global trend.
The United Nations categorizes countries along a scale of geopolitical proximity based on UN voting records.
According to the organization’s analysis, international trade between geopolitically close countries rose from the first quarter of 2022 (when Russia first invaded Ukraine) to the third quarter of 2023 by over 6%. Conversely, trade with geopolitically distant countries declined.
The second piece in this series will explore China’s gradual move away from using the U.S. dollar in trade settlements.
Visit the Hinrich Foundation to learn more about the future of geopolitical trade

-

 Economy3 days ago
Economic Growth Forecasts for G7 and BRICS Countries in 2024
The IMF has released its economic growth forecasts for 2024. How do the G7 and BRICS countries compare?
-

 United States2 weeks ago
Ranked: The Largest U.S. Corporations by Number of Employees
We visualized the top U.S. companies by employees, revealing the massive scale of retailers like Walmart, Target, and Home Depot.
-

 Economy2 weeks ago
Where U.S. Inflation Hit the Hardest in March 2024
We visualized product categories that saw the highest % increase in price due to U.S. inflation as of March 2024.
-

 Economy1 month ago
G20 Inflation Rates: Feb 2024 vs COVID Peak
We visualize inflation rates across G20 countries as of Feb 2024, in the context of their COVID-19 pandemic peak.
-

 Economy1 month ago
Mapped: Unemployment Claims by State
This visual heatmap of unemployment claims by state highlights New York, California, and Alaska leading the country by a wide margin.
-

 Economy2 months ago
Confidence in the Global Economy, by Country
Will the global economy be stronger in 2024 than in 2023?


-

 Debt1 week ago
How Debt-to-GDP Ratios Have Changed Since 2000
-

 Demographics2 weeks ago
Population Projections: The World’s 6 Largest Countries in 2075
-

 Markets2 weeks ago
The Top 10 States by Real GDP Growth in 2023
-

 Demographics2 weeks ago
The Smallest Gender Wage Gaps in OECD Countries
-
Economy2 weeks ago
Where U.S. Inflation Hit the Hardest in March 2024
-

 Green2 weeks ago
Top Countries By Forest Growth Since 2001
-
United States2 weeks ago
Ranked: The Largest U.S. Corporations by Number of Employees
-

 Maps2 weeks ago
The Largest Earthquakes in the New York Area (1970-2024)