Mining
China Dominates the Supply of U.S. Critical Minerals List
![]() See this visualization first on the Voronoi app.
See this visualization first on the Voronoi app.
China Dominates the Supply of U.S. Critical Minerals List
This was originally posted on our Voronoi app. Download the app for free on iOS or Android and discover incredible data-driven charts from a variety of trusted sources.
Most countries have, for many decades, kept a record of their own critical minerals list.
For example, the U.S., drew up a list of “war minerals” during World War I, containing important minerals which could not be found and produced in abundance domestically. They included: tin, nickel, platinum, nitrates and potash.
Since then, as the economy has grown and innovated, critical mineral lists have expanded considerably. The Energy Act of 2020 defines a critical mineral as:
“A non-fuel mineral or mineral material essential to the economic or national security of the U.S., whose supply chains are vulnerable to disruption.” — Energy Act, 2020.
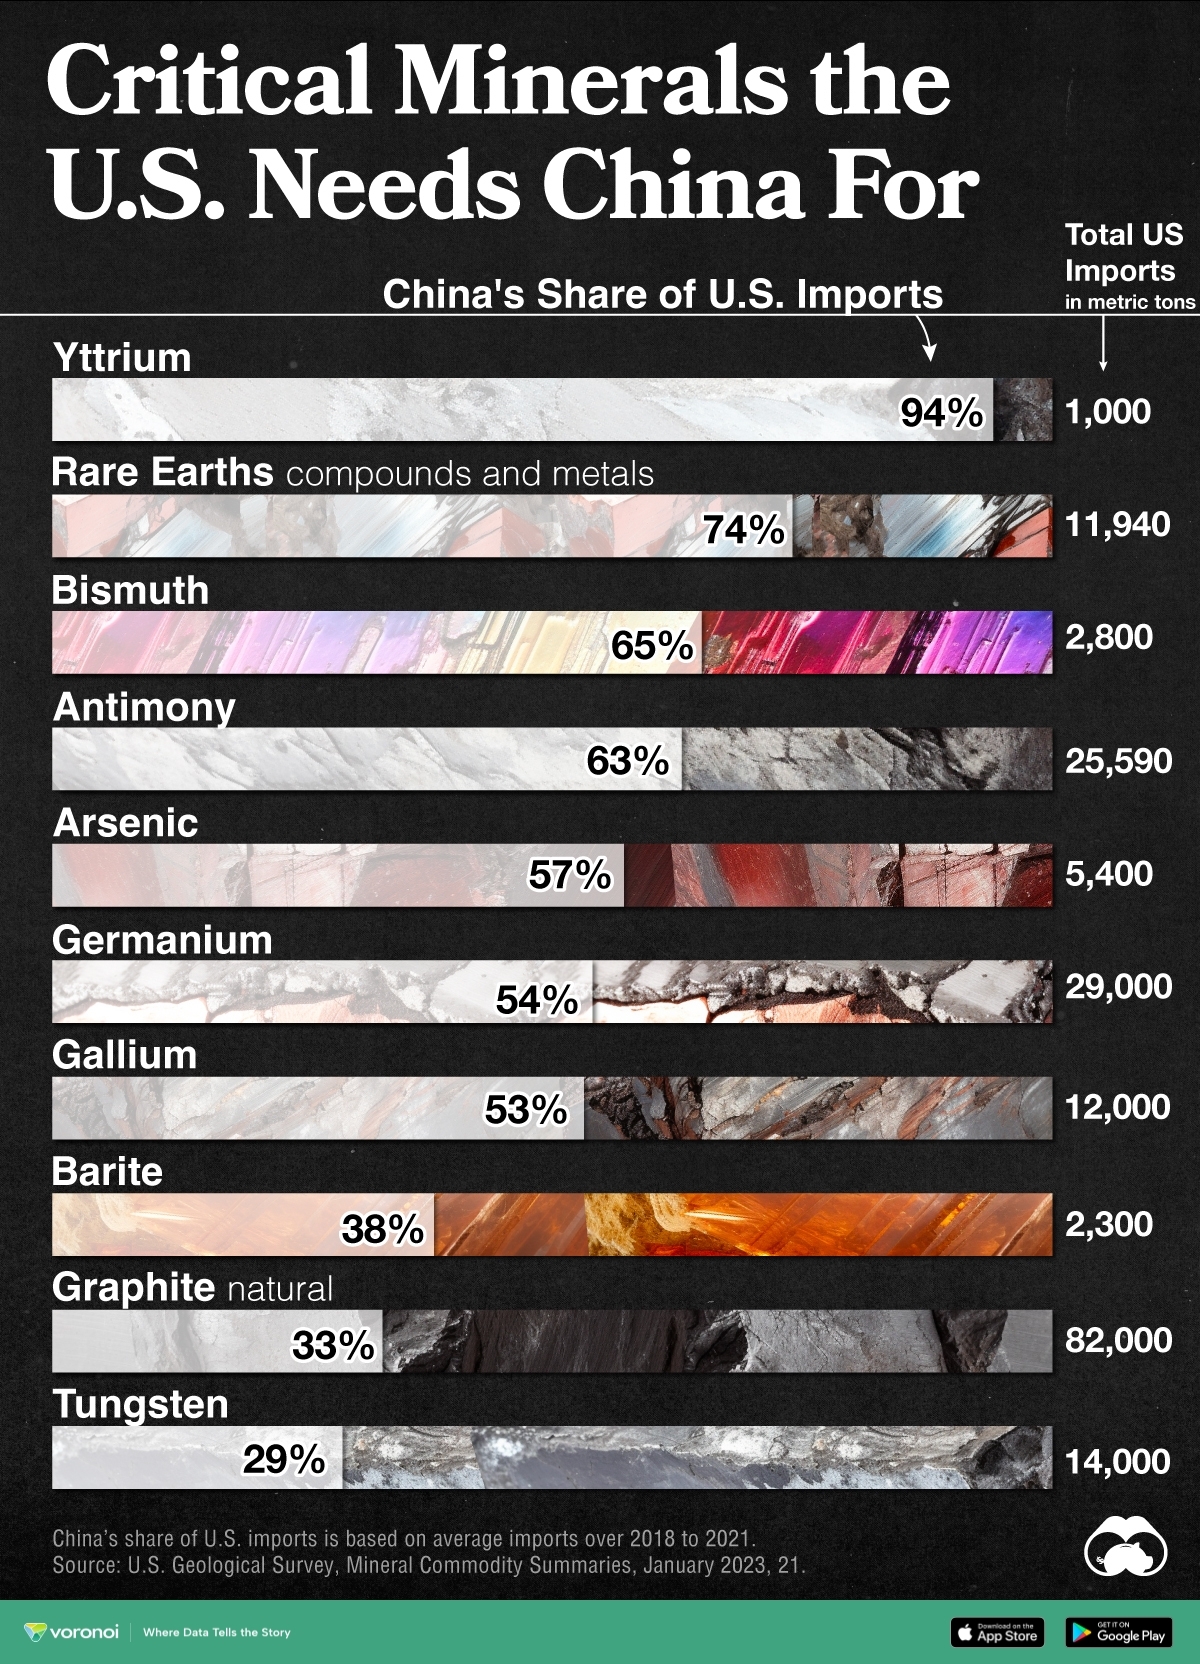
Currently there are 50 entries on this list and the U.S. Geological Survey (USGS) estimates that China is the leading producer for 30 of them. From USGS data, we visualize China’s share of U.S. imports for 10 critical minerals.
What Key Critical Minerals Does the U.S. Import From China?
The U.S. is 100% import-reliant for its supply of yttrium, with China responsible for 94% of U.S. imports of the metal from 2018 to 2021.
A soft silvery metal, yttrium is used as an additive for alloys, making microwave filters for radars, and as a catalyst in ethylene polymerization—a key process in making certain kinds of plastic.
China is a major supplier of the following listed critical minerals to the U.S.
| Critical Mineral | China's Share of U.S. Imports | U.S. Imports (Tonnes) | Uses |
|---|---|---|---|
| Yttrium | 94% | 1,000 | Catalyst, Microwave filters |
| Rare Earths | 74% | 11,940 | Smartphones, Cameras |
| Bismuth | 65% | 2,800 | Metallurgy |
| Antimony | 63% | 25,590 | Batteries |
| Arsenic | 57% | 5,400 | Semiconductors |
| Germanium | 54% | 29,000 | Chips, Fiber optics |
| Gallium | 53% | 12,000 | Chips, Fiber optics |
| Barite | 38% | 2,300 | Hydrocarbon production |
| Graphite (natural) | 33% | 82,000 | Batteries, Lubricants |
| Tungsten | 29% | 14,000 | Metallurgy |
Note: China’s share of U.S. critical minerals imports is based on average imports from 2018 to 2021.
Meanwhile, the U.S. also imports nearly three-quarters of its rare earth compounds and metals demand from China. Rare earth elements—so called since they are not found in easily-mined, concentrated clusters—are a collection of 15 elements on the periodic table, known as the lanthanide series.
Rare earths are used in smartphones, cameras, hard disks, and LEDs but also, crucially, in the clean energy and defense industries.
Does China’s Dominance of U.S. Critical Minerals Supply Matter?
The USGS estimates that China could potentially disrupt the global rare earth oxide supply by cutting off 40–50% production, impacting suppliers of advanced components used in U.S. defense systems.
A version of this sort of trade warfare is already playing out. Earlier this year, China implemented export controls on germanium and gallium. The U.S. relies on China for around 54% of its demand for both minerals, used for producing chips, solar panels, and fiber optics.
China’s controls were seen as a retaliation against the U.S. which has restricted the supply of chips, chip design software, and lithography machines to Chinese companies.


Lithium
Ranked: The Top 10 EV Battery Manufacturers in 2023
Asia dominates this ranking of the world’s largest EV battery manufacturers in 2023.


The Top 10 EV Battery Manufacturers in 2023
This was originally posted on our Voronoi app. Download the app for free on iOS or Android and discover incredible data-driven charts from a variety of trusted sources.
Despite efforts from the U.S. and EU to secure local domestic supply, all major EV battery manufacturers remain based in Asia.
In this graphic we rank the top 10 EV battery manufacturers by total battery deployment (measured in megawatt-hours) in 2023. The data is from EV Volumes.
Chinese Dominance
Contemporary Amperex Technology Co. Limited (CATL) has swiftly risen in less than a decade to claim the title of the largest global battery group.
The Chinese company now has a 34% share of the market and supplies batteries to a range of made-in-China vehicles, including the Tesla Model Y, SAIC’s MG4/Mulan, and various Li Auto models.
| Company | Country | 2023 Production (megawatt-hour) | Share of Total Production |
|---|---|---|---|
| CATL | 🇨🇳 China | 242,700 | 34% |
| BYD | 🇨🇳 China | 115,917 | 16% |
| LG Energy Solution | 🇰🇷 Korea | 108,487 | 15% |
| Panasonic | 🇯🇵 Japan | 56,560 | 8% |
| SK On | 🇰🇷 Korea | 40,711 | 6% |
| Samsung SDI | 🇰🇷 Korea | 35,703 | 5% |
| CALB | 🇨🇳 China | 23,493 | 3% |
| Farasis Energy | 🇨🇳 China | 16,527 | 2% |
| Envision AESC | 🇨🇳 China | 8,342 | 1% |
| Sunwoda | 🇨🇳 China | 6,979 | 1% |
| Other | - | 56,040 | 8% |
In 2023, BYD surpassed LG Energy Solution to claim second place. This was driven by demand from its own models and growth in third-party deals, including providing batteries for the made-in-Germany Tesla Model Y, Toyota bZ3, Changan UNI-V, Venucia V-Online, as well as several Haval and FAW models.
The top three battery makers (CATL, BYD, LG) collectively account for two-thirds (66%) of total battery deployment.
Once a leader in the EV battery business, Panasonic now holds the fourth position with an 8% market share, down from 9% last year. With its main client, Tesla, now sourcing batteries from multiple suppliers, the Japanese battery maker seems to be losing its competitive edge in the industry.
Overall, the global EV battery market size is projected to grow from $49 billion in 2022 to $98 billion by 2029, according to Fortune Business Insights.

-

 Education1 week ago
How Hard Is It to Get Into an Ivy League School?
-

 Technology2 weeks ago
Ranked: Semiconductor Companies by Industry Revenue Share
-

 Markets2 weeks ago
Ranked: The World’s Top Flight Routes, by Revenue
-

 Demographics2 weeks ago
Population Projections: The World’s 6 Largest Countries in 2075
-

 Markets2 weeks ago
The Top 10 States by Real GDP Growth in 2023
-

 Demographics2 weeks ago
The Smallest Gender Wage Gaps in OECD Countries
-

 Economy2 weeks ago
Where U.S. Inflation Hit the Hardest in March 2024
-

 Green2 weeks ago
Top Countries By Forest Growth Since 2001