United States
U.S. Trade: Visualizing Share of Imports for Select Countries (1989-2023)
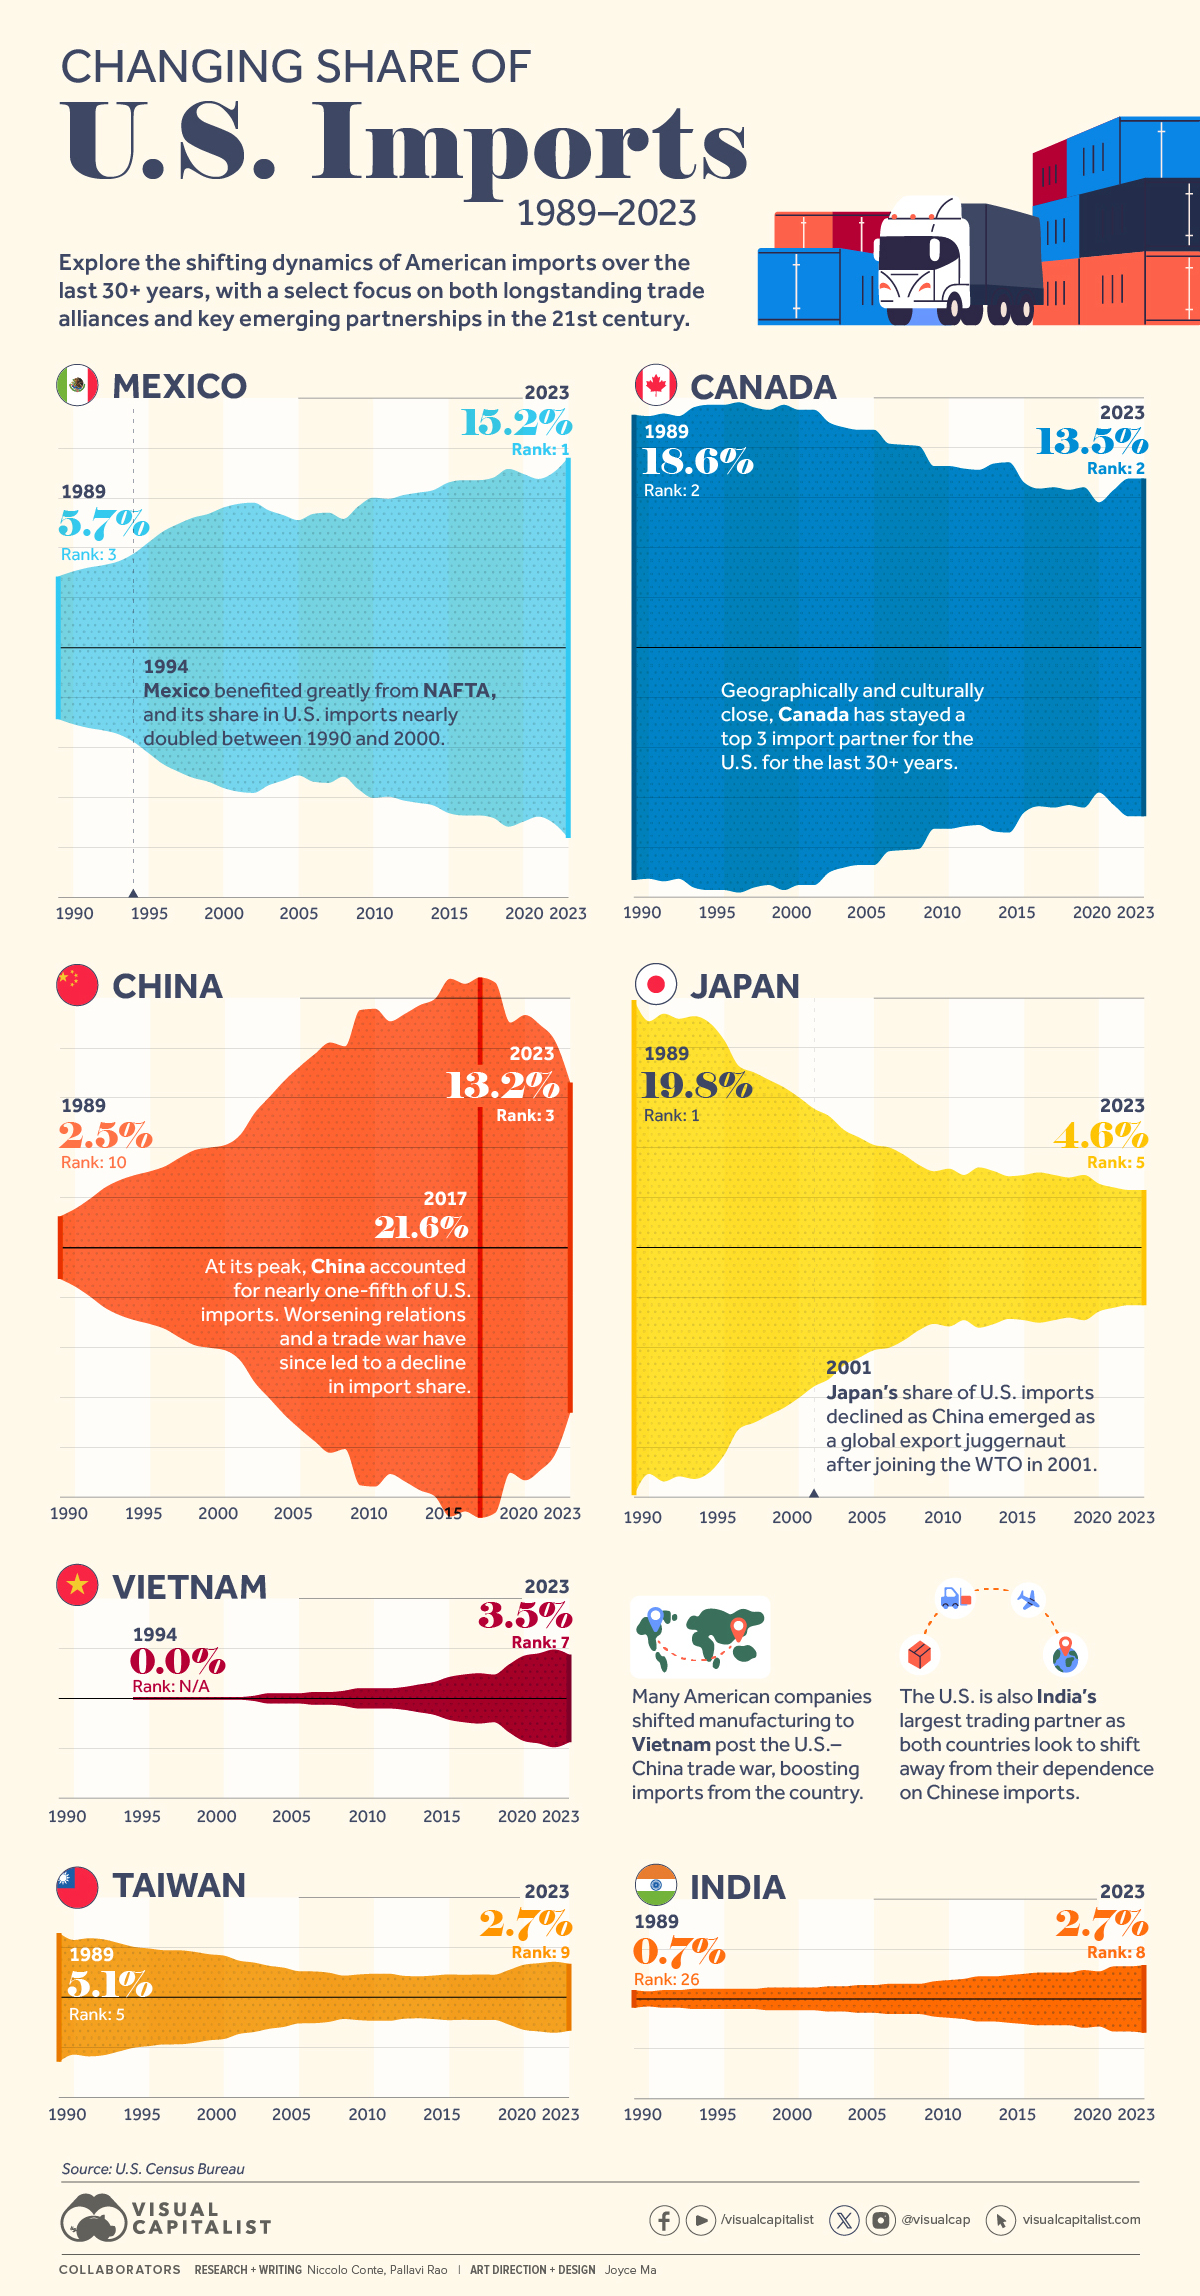
U.S. Trade: Sources and Share of American Imports (1989–2023)
Since 1989, the U.S.’ largest trade partner by share of imports has changed four times.
Similarly, the top 10 ranking of importers has seen a shuffle as well, as some countries gain share and eclipse rivals due to favorable trade policies and economic conditions.
We highlight the changing fortunes of seven select countries—past alliances and emerging partnerships—that are major sources of U.S. trade, using data from the U.S. Census Bureau.
Seven Major Sources of U.S. Trade (1989–2023)
Neighbors, allies, former enemies, and rivals make for an all-star cast.
- Canada, Mexico & NAFTA (now USMCA)
As the U.S.’ closest land neighbors, Canada and Mexico have been amongst the country’s largest trade partners for many years. Along with their geographic proximity, the key North American Free Trade Agreement (NAFTA) which took effect in 1994, allowed the free movement of goods across the three countries.
Mexico in particular benefited greatly from NAFTA, and has become the primary source of agricultural products for both the U.S., and Canada. In 2022 the country overtook China to become the U.S.’ largest source of foreign goods and services after the EU, at 15.2% of import share. Both countries together account for one-third of all U.S. inbound trade.
| Country | 1989 | 2001 | 2023 |
|---|---|---|---|
| 🇨🇦 Canada | 18.6% | 19.0% | 13.5% |
| 🇨🇳 China | 2.5% | 9.0% | 13.2% |
| 🇮🇳 India | 0.7% | 0.9% | 2.7% |
| 🇯🇵 Japan | 19.8% | 11.1% | 4.6% |
| 🇲🇽 Mexico | 5.7% | 11.5% | 15.2% |
| 🇹🇼 Taiwan | 5.1% | 2.9% | 2.7% |
| 🇻🇳 Vietnam | 0% | 0.1% | 3.5% |
- Japan, and the Lost Decades
Japan’s post-war economic boom reached its zenith by the late 1980s and Asia’s largest economy at the time was also the largest source of U.S. inbound trade, accounting for nearly one-fifth of U.S. imports on its own.
However, by the mid-1990s, the Japanese economy entered a period of stagnation, and along with the signing of NAFTA, which boosted both Canada and Mexico, Japan’s share of U.S. inbound trade started slipping. After 2001, when China joined the World Trade Organization, Japan’s share of U.S. imports dropped even further to 4.6% in 2023.
- China: Challenger to Challenged
China’s rapid export rise in the 2000s singlehandedly defined the country as the world’s manufacturer. Between 2001–2022, Chinese exports to the U.S. grew nearly 1,000% to $600 billion. In 2017 the country was the source of more than one-fifth of all U.S. imports. However, the U.S.-China trade war kicked off by the Trump administration reduced China’s share in U.S. inbound trade (down to 13.2% in 2023) as other economies in South and Southeast Asia have grown to become manufacturing hotspots in the last few years.
Emerging Partnerships Diversify Sources of U.S. Trade
Vietnam in particular has benefited hugely from the U.S. (and other countries) turning away from China. The country prioritized education to turn its large population into a skilled workforce. As a result, Vietnam has jumped up the ranks of the top sources of U.S. imports, coming in 7th in 2023. This is contrasted with not even having trade relations with the U.S. in 1989, a policy remnant from the Vietnam War.
India has also found a niche as a source for gold and jewelry for the United States. With rumors of American companies shifting manufacturing to the 5th largest economy in the world, their share in U.S. imports may only further increase.
Meanwhile, Taiwan which prioritized an export-oriented economy since the 1950s has also been losing share in the U.S.—their biggest export market in 1990. The rise of China, and subsequently Vietnam, Indonesia, and Thailand, has altered the Taiwanese export sector which ships semi-finished goods to its neighbors, from where they eventually make their way to the United States.


United States
Visualizing the Most Common Pets in the U.S.
Lions, tigers, and bears, oh my!—these animals do not feature on this list of popular American household pets.


Visualizing The Most Common Pets in the U.S.
This was originally posted on our Voronoi app. Download the app for free on iOS or Android and discover incredible data-driven charts from a variety of trusted sources.
In this graphic, we visualized the most common American household pets, based on 2023-2024 data from the American Pet Products Association (accessed via Forbes Advisor).
Figures represent the number of households that own each pet type, rather than the actual number of each animal. The “small animal” category includes hamsters, gerbils, rabbits, guinea pigs, chinchillas, mice, rats, and ferrets.
What is the Most Popular American Household Pet?
Based on this data, dogs—one of the first domesticated animals—are the most common pets in the United States. In fact, around 65 million households own a dog, and spend an average of $900 a year on their care.
| Rank | Species | Households |
|---|---|---|
| 1 | 🐶 Dog | 65M |
| 2 | 🐱 Cat | 47M |
| 3 | 🐟 Freshwater Fish | 11M |
| 4 | 🐰 Small Animals | 7M |
| 5 | 🐦 Bird | 6M |
| 6 | 🦎 Reptile | 6M |
| 7 | 🐴 Horse | 2M |
| 8 | 🐠 Saltwater Fish | 2M |
Note: Households can own multiple pets, and are counted for all relevant categories.
Cats rank second, at 47 million households, and these smaller felines are a little less expensive to own at $700/year according to Forbes estimates.
But aside from these two juggernauts, there are plenty of other common pet types found in households across the country.
Freshwater fish can be found in 11 million households, along with small animals—rabbits, hamsters, guinea pigs—in 7 million. Meanwhile, nearly 6 million homes have birds or reptiles.
Pet Ownership is on the Rise in America
Forbes found that 66% of all American households (numbering 87 million) own at least one pet, up from 56% in 1988. One third of these (29 million) own multiple pets.
A combination of factors is driving this increase: rising incomes, delayed childbirth, and of course the impact of the pandemic which nearly cleared out animal shelters across the globe.
America’s loneliness epidemic may also be a factor. Fledgling research has shown that single-individual households with pets recorded lower rates of loneliness during the pandemic than those without a pet.

-

 Science7 days ago
Visualizing the Average Lifespans of Mammals
-

 Markets2 weeks ago
The Top 10 States by Real GDP Growth in 2023
-

 Demographics2 weeks ago
The Smallest Gender Wage Gaps in OECD Countries
-

 United States2 weeks ago
Where U.S. Inflation Hit the Hardest in March 2024
-

 Green2 weeks ago
Top Countries By Forest Growth Since 2001
-

 United States2 weeks ago
Ranked: The Largest U.S. Corporations by Number of Employees
-

 Maps2 weeks ago
The Largest Earthquakes in the New York Area (1970-2024)
-

 Green2 weeks ago
Ranked: The Countries With the Most Air Pollution in 2023