Markets
Ranked: Share of Million-Dollar Homes in U.S. Cities
Share of Million-Dollar Homes in U.S. Cities
Nearly one-in-ten U.S. homes are now worth at least $1 million.
Analysis from Redfin has found that 8.2% of homes in America were million-dollar homes as of June 2023, nearing the June 2022 peak of 8.6%.
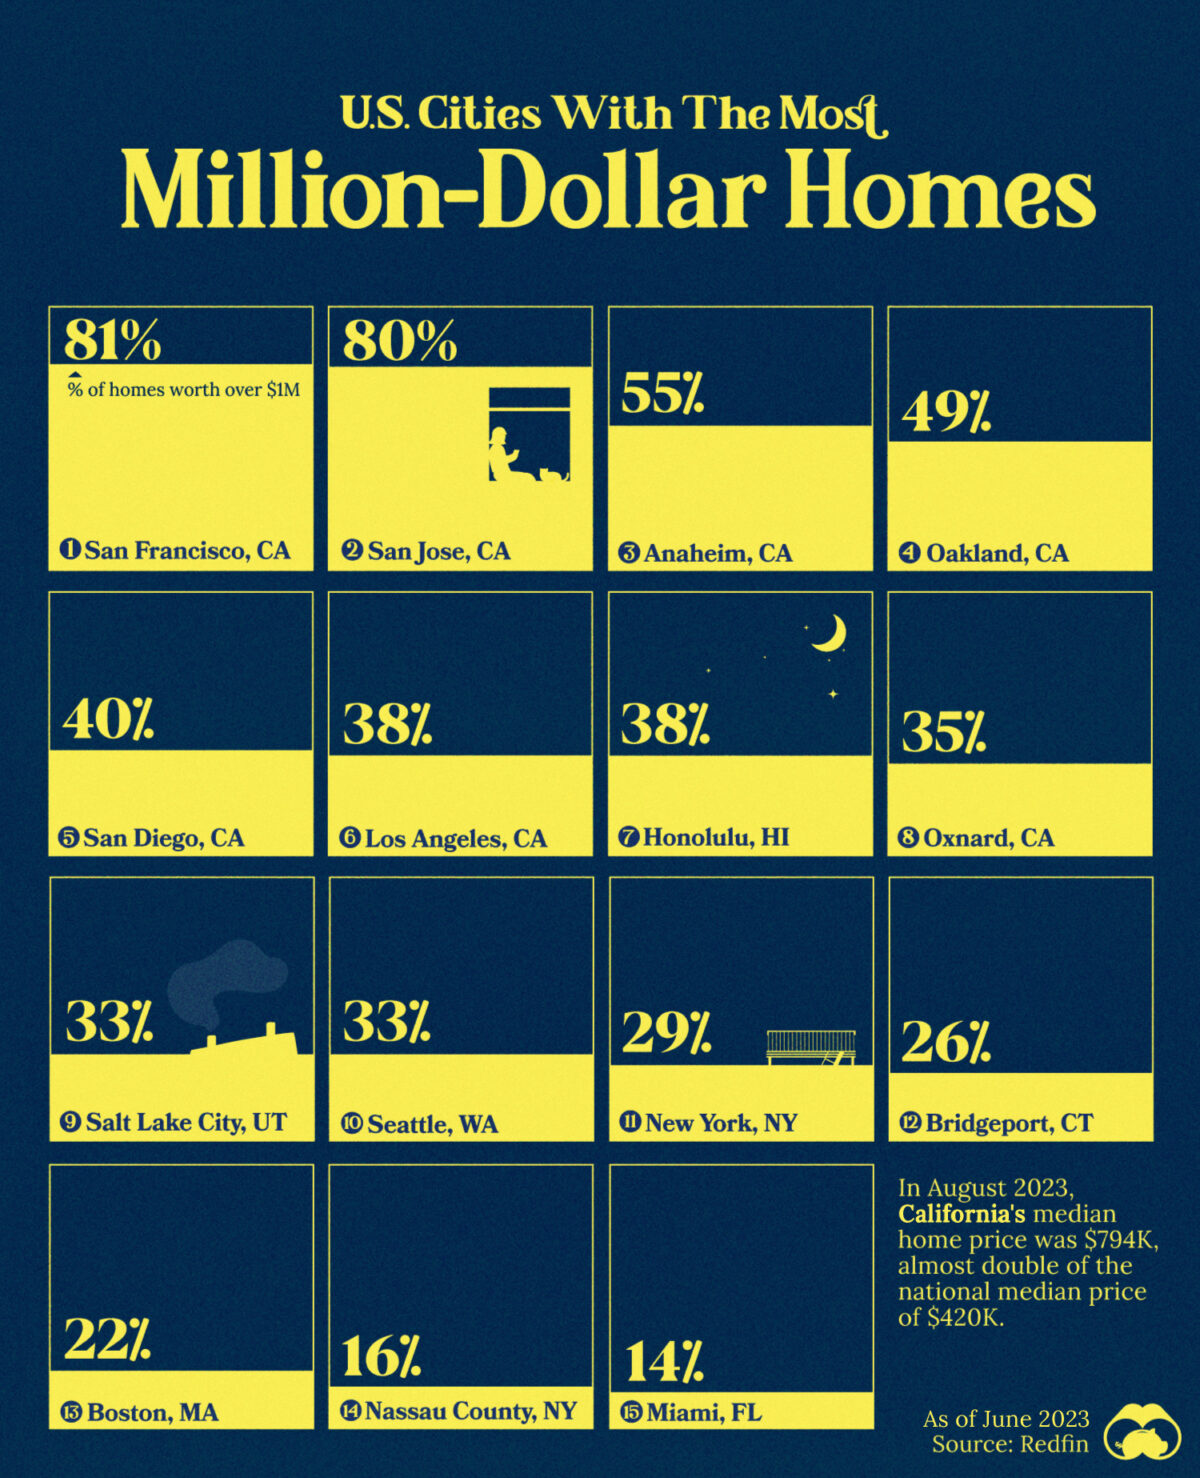
In the graphic above, we use Redfin and MLS data to highlight the top 15 U.S. cities by their percentage of million-dollar homes, based on June 2023 home values in metropolitan statistical areas (MSA).
Top 15 U.S. Metros by Share of Million-Dollar Residences
California has seen an exodus of residents over the last few years due to many factors, but the state still has the highest share of million-dollar homes in the country by far.
Cities in California claimed the top six spots by share of million-dollar homes in June 2023. Here are the top 15, along with the change since June 2022 in percentage points (p.p.).
| Rank | U.S. Metro | $1M+ Homes (June 2023) | Annual Change |
|---|---|---|---|
| 1 | San Francisco, CA | 81% | -3 p.p. |
| 2 | San Jose, CA | 80% | -3 p.p. |
| 3 | Anaheim, CA | 55% | -2 p.p. |
| 4 | Oakland, CA | 49% | -6 p.p. |
| 5 | San Diego, CA | 40% | -4 p.p. |
| 6 | Los Angeles, CA | 38% | -5 p.p. |
| 7 | Honolulu, HI | 38% | -4 p.p. |
| 8 | Oxnard, CA | 35% | -6 p.p. |
| 9 | Salt Lake City, UT | 33% | 0 p.p. |
| 10 | Seattle, WA | 33% | -6 p.p. |
| 11 | New York, NY | 29% | 0 p.p. |
| 12 | Bridgeport, CT | 26% | 3 p.p. |
| 13 | Boston, MA | 22% | 1 p.p. |
| 14 | Nassau County, NY | 16% | 1 p.p. |
| 15 | Miami, FL | 14% | 1 p.p. |
First is San Francisco, where 81% of homes were worth at least $1 million. This is actually lower than the year previous, which saw 84.2% of homes cost more than one million dollars.
Neighboring San Jose, home of Silicon Valley, was second place with million-dollar homes accounting for 80% of residences. The entire San Francisco Bay Area is the most expensive real estate market in America, with Oakland also having 49% of homes costing $1 million or more.
Southern California also featured prominently, with Anaheim (55%) actually outranking San Diego (40%) and Los Angeles (38%). The first non-California metro to make the rankings was Hawaii’s Honolulu at 38%.
Other regions to feature at the top of the rankings were the Western U.S. (Seattle and Salt Lake City) and the Northeast (New York City, Bridgeport, and Boston). Miami was the sole entry from the South, with far lower shares of million-dollar homes in major metros like Dallas-Fort Worth, Atlanta, and Phoenix.
Share of Million-Dollar Homes Doubled Since 2019
One reason for the increase in housing prices is intense competition for those trying to enter the housing market.
Many existing homeowners are opting to stay put in their current residences to retain their relatively low mortgage rates, with the U.S. 30-year fixed-rate mortgage reaching its highest level since 2002.
Subsequently, the high cost of financing has also caused development to slow down. But high demand from new potential homeowners has propelled prices to new heights. According to Redfin, the share of homes worth seven figures has doubled since before the pandemic.


Markets
The European Stock Market: Attractive Valuations Offer Opportunities
On average, the European stock market has valuations that are nearly 50% lower than U.S. valuations. But how can you access the market?


European Stock Market: Attractive Valuations Offer Opportunities
Europe is known for some established brands, from L’Oréal to Louis Vuitton. However, the European stock market offers additional opportunities that may be lesser known.
The above infographic, sponsored by STOXX, outlines why investors may want to consider European stocks.
Attractive Valuations
Compared to most North American and Asian markets, European stocks offer lower or comparable valuations.
| Index | Price-to-Earnings Ratio | Price-to-Book Ratio |
|---|---|---|
| EURO STOXX 50 | 14.9 | 2.2 |
| STOXX Europe 600 | 14.4 | 2 |
| U.S. | 25.9 | 4.7 |
| Canada | 16.1 | 1.8 |
| Japan | 15.4 | 1.6 |
| Asia Pacific ex. China | 17.1 | 1.8 |
Data as of February 29, 2024. See graphic for full index names. Ratios based on trailing 12 month financials. The price to earnings ratio excludes companies with negative earnings.
On average, European valuations are nearly 50% lower than U.S. valuations, potentially offering an affordable entry point for investors.
Research also shows that lower price ratios have historically led to higher long-term returns.
Market Movements Not Closely Connected
Over the last decade, the European stock market had low-to-moderate correlation with North American and Asian equities.
The below chart shows correlations from February 2014 to February 2024. A value closer to zero indicates low correlation, while a value of one would indicate that two regions are moving in perfect unison.
| EURO STOXX 50 | STOXX EUROPE 600 | U.S. | Canada | Japan | Asia Pacific ex. China |
|
|---|---|---|---|---|---|---|
| EURO STOXX 50 | 1.00 | 0.97 | 0.55 | 0.67 | 0.24 | 0.43 |
| STOXX EUROPE 600 | 1.00 | 0.56 | 0.71 | 0.28 | 0.48 | |
| U.S. | 1.00 | 0.73 | 0.12 | 0.25 | ||
| Canada | 1.00 | 0.22 | 0.40 | |||
| Japan | 1.00 | 0.88 | ||||
| Asia Pacific ex. China | 1.00 |
Data is based on daily USD returns.
European equities had relatively independent market movements from North American and Asian markets. One contributing factor could be the differing sector weights in each market. For instance, technology makes up a quarter of the U.S. market, but health care and industrials dominate the broader European market.
Ultimately, European equities can enhance portfolio diversification and have the potential to mitigate risk for investors.
Tracking the Market
For investors interested in European equities, STOXX offers a variety of flagship indices:
| Index | Description | Market Cap |
|---|---|---|
| STOXX Europe 600 | Pan-regional, broad market | €10.5T |
| STOXX Developed Europe | Pan-regional, broad-market | €9.9T |
| STOXX Europe 600 ESG-X | Pan-regional, broad market, sustainability focus | €9.7T |
| STOXX Europe 50 | Pan-regional, blue-chip | €5.1T |
| EURO STOXX 50 | Eurozone, blue-chip | €3.5T |
Data is as of February 29, 2024. Market cap is free float, which represents the shares that are readily available for public trading on stock exchanges.
The EURO STOXX 50 tracks the Eurozone’s biggest and most traded companies. It also underlies one of the world’s largest ranges of ETFs and mutual funds. As of November 2023, there were €27.3 billion in ETFs and €23.5B in mutual fund assets under management tracking the index.
“For the past 25 years, the EURO STOXX 50 has served as an accurate, reliable and tradable representation of the Eurozone equity market.”
— Axel Lomholt, General Manager at STOXX
Partnering with STOXX to Track the European Stock Market
Are you interested in European equities? STOXX can be a valuable partner:
- Comprehensive, liquid and investable ecosystem
- European heritage, global reach
- Highly sophisticated customization capabilities
- Open architecture approach to using data
- Close partnerships with clients
- Part of ISS STOXX and Deutsche Börse Group
With a full suite of indices, STOXX can help you benchmark against the European stock market.
Learn how STOXX’s European indices offer liquid and effective market access.

-

 Economy3 days ago
Economic Growth Forecasts for G7 and BRICS Countries in 2024
The IMF has released its economic growth forecasts for 2024. How do the G7 and BRICS countries compare?
-

 Markets2 weeks ago
U.S. Debt Interest Payments Reach $1 Trillion
U.S. debt interest payments have surged past the $1 trillion dollar mark, amid high interest rates and an ever-expanding debt burden.
-

 United States2 weeks ago
Ranked: The Largest U.S. Corporations by Number of Employees
We visualized the top U.S. companies by employees, revealing the massive scale of retailers like Walmart, Target, and Home Depot.
-

 Markets2 weeks ago
The Top 10 States by Real GDP Growth in 2023
This graphic shows the states with the highest real GDP growth rate in 2023, largely propelled by the oil and gas boom.
-

 Markets3 weeks ago
Ranked: The World’s Top Flight Routes, by Revenue
In this graphic, we show the highest earning flight routes globally as air travel continued to rebound in 2023.
-

 Real Estate3 weeks ago
Ranked: The Most Valuable Housing Markets in America
The U.S. residential real estate market is worth a staggering $47.5 trillion. Here are the most valuable housing markets in the country.


-

 Debt1 week ago
How Debt-to-GDP Ratios Have Changed Since 2000
-

 Countries2 weeks ago
Population Projections: The World’s 6 Largest Countries in 2075
-
Markets2 weeks ago
The Top 10 States by Real GDP Growth in 2023
-

 Demographics2 weeks ago
The Smallest Gender Wage Gaps in OECD Countries
-

 United States2 weeks ago
Where U.S. Inflation Hit the Hardest in March 2024
-

 Green2 weeks ago
Top Countries By Forest Growth Since 2001
-
United States2 weeks ago
Ranked: The Largest U.S. Corporations by Number of Employees
-

 Maps2 weeks ago
The Largest Earthquakes in the New York Area (1970-2024)