Markets
Charted: The U.S. Mortgage Rate vs. Existing Home Sales
The U.S. Mortgage Rate vs. Existing Home Sales
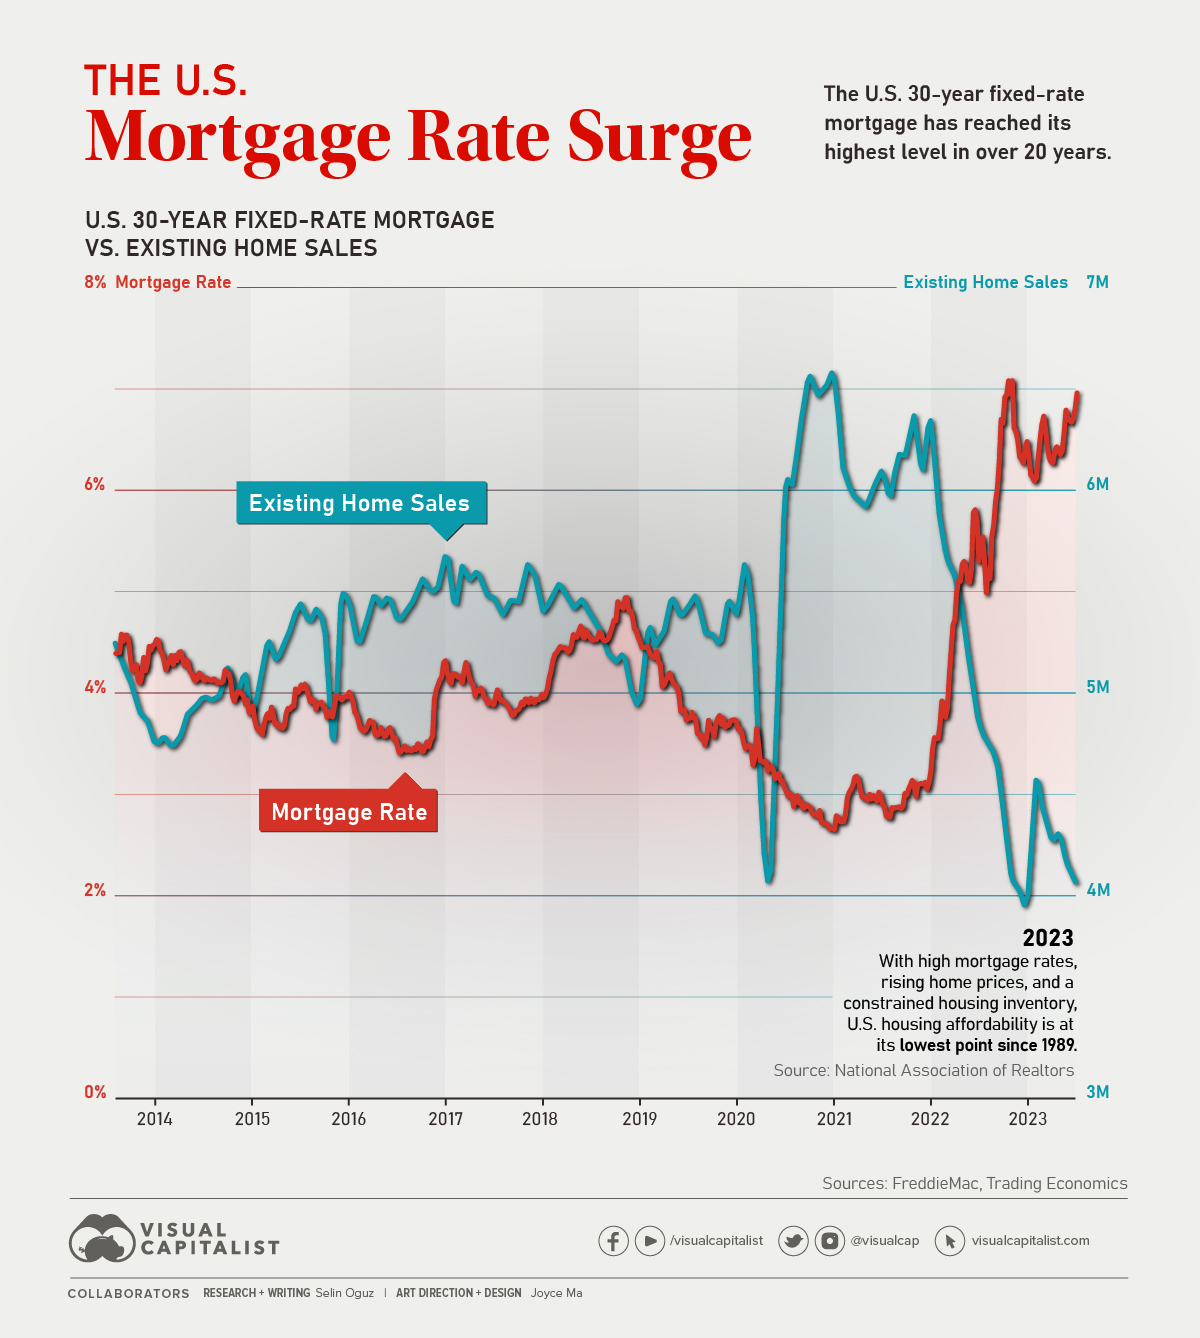
The U.S. 30-year fixed-rate mortgage has reached its highest level since 2002.
Coupled with rising home prices and a constrained housing inventory, U.S. housing affordability is now at its lowest point since 1989, according to the National Association of Realtors.
In the graphic above, we take a closer look at how the U.S. 30-year fixed-rate mortgage has evolved since 2013 against the backdrop of existing home sales, using data from both Freddie Mac and Trading Economics.
A Decade in Review: U.S. 30-Year Fixed-Rate Mortgages
Due to the stability and predictability they offer, fixed-rate mortgages remain very popular among American homebuyers. In 2021, 30-year fixed-rate mortgages made up 70% of all issued mortgages in the country.
Let’s take a look at how U.S. 30-year mortgage rates have evolved through the years.
| Year | Average 30-Year Fixed-Rate Mortgage |
|---|---|
| 2023 (Year-to-Date) | 6.65% |
| 2022 | 5.34% |
| 2021 | 2.96% |
| 2020 | 3.11% |
| 2019 | 3.94% |
| 2018 | 4.54% |
| 2017 | 3.99% |
| 2016 | 3.65% |
| 2015 | 3.85% |
| 2014 | 4.17% |
In the last few years alone, Americans have seen 30-year fixed-rate mortgages hit their lowest point in U.S. history—2.65% in January 2021—as well as skyrocket to their current rate of 7.31% (as of October 3, 2023.)
Naturally, this surge may leave many people wondering about the reasons behind this drastic change and whether they will drop any time soon.
Why Do Mortgage Rates Rise?
Mortgage rates rise in response to various economic indicators and policy changes.
Over the years, factors such as shifts in the Federal Reserve’s monetary policy, inflation concerns, the state of the bond market, and fluctuations in economic growth have all played roles in influencing mortgage rates.
2023 is no different, with many different economic and global events at play. It’s also notable that these high mortgage rates are affecting home sales in the U.S., specifically with existing home sales taking a dip while new home sales subtly rise.
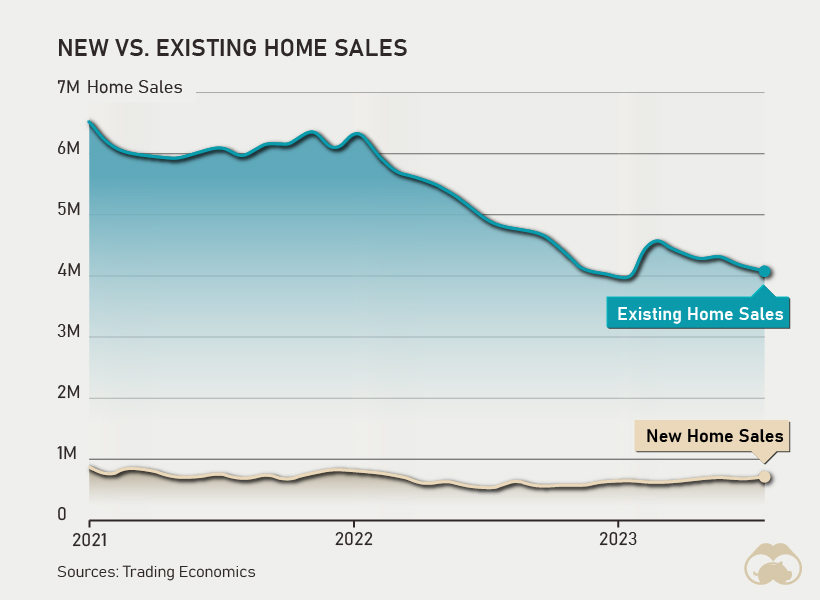
This change in dynamics is occurring as homeowners with low mortgage rates hesitate to sell their homes and get back in the market amidst high mortgage rates. In turn, demand from buyers is increasing new home sales and pushing prices even higher.
What’s In Store for U.S. Mortgage Rates?
U.S. mortgage rates remain above 7% for the time being. However, experts suggest that rates may have already peaked and will likely start to fall in the coming months as recession fears subside and the economy regains its momentum.
The Mortgage Bankers Association estimates that the U.S. 30-year fixed-rate mortgage will fall to 6.3% by the end of 2023 and 5.4% by the end of 2024. Based on these predictions, it’s likely that the rates that characterized 2020 and 2021 will not be returning for some time to come, despite their downward trend.


Markets
The European Stock Market: Attractive Valuations Offer Opportunities
On average, the European stock market has valuations that are nearly 50% lower than U.S. valuations. But how can you access the market?


European Stock Market: Attractive Valuations Offer Opportunities
Europe is known for some established brands, from L’Oréal to Louis Vuitton. However, the European stock market offers additional opportunities that may be lesser known.
The above infographic, sponsored by STOXX, outlines why investors may want to consider European stocks.
Attractive Valuations
Compared to most North American and Asian markets, European stocks offer lower or comparable valuations.
| Index | Price-to-Earnings Ratio | Price-to-Book Ratio |
|---|---|---|
| EURO STOXX 50 | 14.9 | 2.2 |
| STOXX Europe 600 | 14.4 | 2 |
| U.S. | 25.9 | 4.7 |
| Canada | 16.1 | 1.8 |
| Japan | 15.4 | 1.6 |
| Asia Pacific ex. China | 17.1 | 1.8 |
Data as of February 29, 2024. See graphic for full index names. Ratios based on trailing 12 month financials. The price to earnings ratio excludes companies with negative earnings.
On average, European valuations are nearly 50% lower than U.S. valuations, potentially offering an affordable entry point for investors.
Research also shows that lower price ratios have historically led to higher long-term returns.
Market Movements Not Closely Connected
Over the last decade, the European stock market had low-to-moderate correlation with North American and Asian equities.
The below chart shows correlations from February 2014 to February 2024. A value closer to zero indicates low correlation, while a value of one would indicate that two regions are moving in perfect unison.
| EURO STOXX 50 | STOXX EUROPE 600 | U.S. | Canada | Japan | Asia Pacific ex. China |
|
|---|---|---|---|---|---|---|
| EURO STOXX 50 | 1.00 | 0.97 | 0.55 | 0.67 | 0.24 | 0.43 |
| STOXX EUROPE 600 | 1.00 | 0.56 | 0.71 | 0.28 | 0.48 | |
| U.S. | 1.00 | 0.73 | 0.12 | 0.25 | ||
| Canada | 1.00 | 0.22 | 0.40 | |||
| Japan | 1.00 | 0.88 | ||||
| Asia Pacific ex. China | 1.00 |
Data is based on daily USD returns.
European equities had relatively independent market movements from North American and Asian markets. One contributing factor could be the differing sector weights in each market. For instance, technology makes up a quarter of the U.S. market, but health care and industrials dominate the broader European market.
Ultimately, European equities can enhance portfolio diversification and have the potential to mitigate risk for investors.
Tracking the Market
For investors interested in European equities, STOXX offers a variety of flagship indices:
| Index | Description | Market Cap |
|---|---|---|
| STOXX Europe 600 | Pan-regional, broad market | €10.5T |
| STOXX Developed Europe | Pan-regional, broad-market | €9.9T |
| STOXX Europe 600 ESG-X | Pan-regional, broad market, sustainability focus | €9.7T |
| STOXX Europe 50 | Pan-regional, blue-chip | €5.1T |
| EURO STOXX 50 | Eurozone, blue-chip | €3.5T |
Data is as of February 29, 2024. Market cap is free float, which represents the shares that are readily available for public trading on stock exchanges.
The EURO STOXX 50 tracks the Eurozone’s biggest and most traded companies. It also underlies one of the world’s largest ranges of ETFs and mutual funds. As of November 2023, there were €27.3 billion in ETFs and €23.5B in mutual fund assets under management tracking the index.
“For the past 25 years, the EURO STOXX 50 has served as an accurate, reliable and tradable representation of the Eurozone equity market.”
— Axel Lomholt, General Manager at STOXX
Partnering with STOXX to Track the European Stock Market
Are you interested in European equities? STOXX can be a valuable partner:
- Comprehensive, liquid and investable ecosystem
- European heritage, global reach
- Highly sophisticated customization capabilities
- Open architecture approach to using data
- Close partnerships with clients
- Part of ISS STOXX and Deutsche Börse Group
With a full suite of indices, STOXX can help you benchmark against the European stock market.
Learn how STOXX’s European indices offer liquid and effective market access.

-

 Economy2 days ago
Economic Growth Forecasts for G7 and BRICS Countries in 2024
The IMF has released its economic growth forecasts for 2024. How do the G7 and BRICS countries compare?
-

 Markets1 week ago
U.S. Debt Interest Payments Reach $1 Trillion
U.S. debt interest payments have surged past the $1 trillion dollar mark, amid high interest rates and an ever-expanding debt burden.
-

 United States2 weeks ago
Ranked: The Largest U.S. Corporations by Number of Employees
We visualized the top U.S. companies by employees, revealing the massive scale of retailers like Walmart, Target, and Home Depot.
-

 Markets2 weeks ago
The Top 10 States by Real GDP Growth in 2023
This graphic shows the states with the highest real GDP growth rate in 2023, largely propelled by the oil and gas boom.
-

 Markets2 weeks ago
Ranked: The World’s Top Flight Routes, by Revenue
In this graphic, we show the highest earning flight routes globally as air travel continued to rebound in 2023.
-

 Markets2 weeks ago
Ranked: The Most Valuable Housing Markets in America
The U.S. residential real estate market is worth a staggering $47.5 trillion. Here are the most valuable housing markets in the country.


-

 Misc1 week ago
How Hard Is It to Get Into an Ivy League School?
-

 Technology2 weeks ago
Ranked: Semiconductor Companies by Industry Revenue Share
-
Markets2 weeks ago
Ranked: The World’s Top Flight Routes, by Revenue
-

 Countries2 weeks ago
Population Projections: The World’s 6 Largest Countries in 2075
-
Markets2 weeks ago
The Top 10 States by Real GDP Growth in 2023
-

 Demographics2 weeks ago
The Smallest Gender Wage Gaps in OECD Countries
-

 United States2 weeks ago
Where U.S. Inflation Hit the Hardest in March 2024
-

 Green2 weeks ago
Top Countries By Forest Growth Since 2001