Money
Mapped: Which Countries Have the Highest Inflation?
![]() Subscribe to the Elements free mailing list for more like this
Subscribe to the Elements free mailing list for more like this
Mapped: Which Countries Have the Highest Inflation Rate?
This was originally posted on Elements. Sign up to the free mailing list to get beautiful visualizations on natural resource megatrends in your email every week.
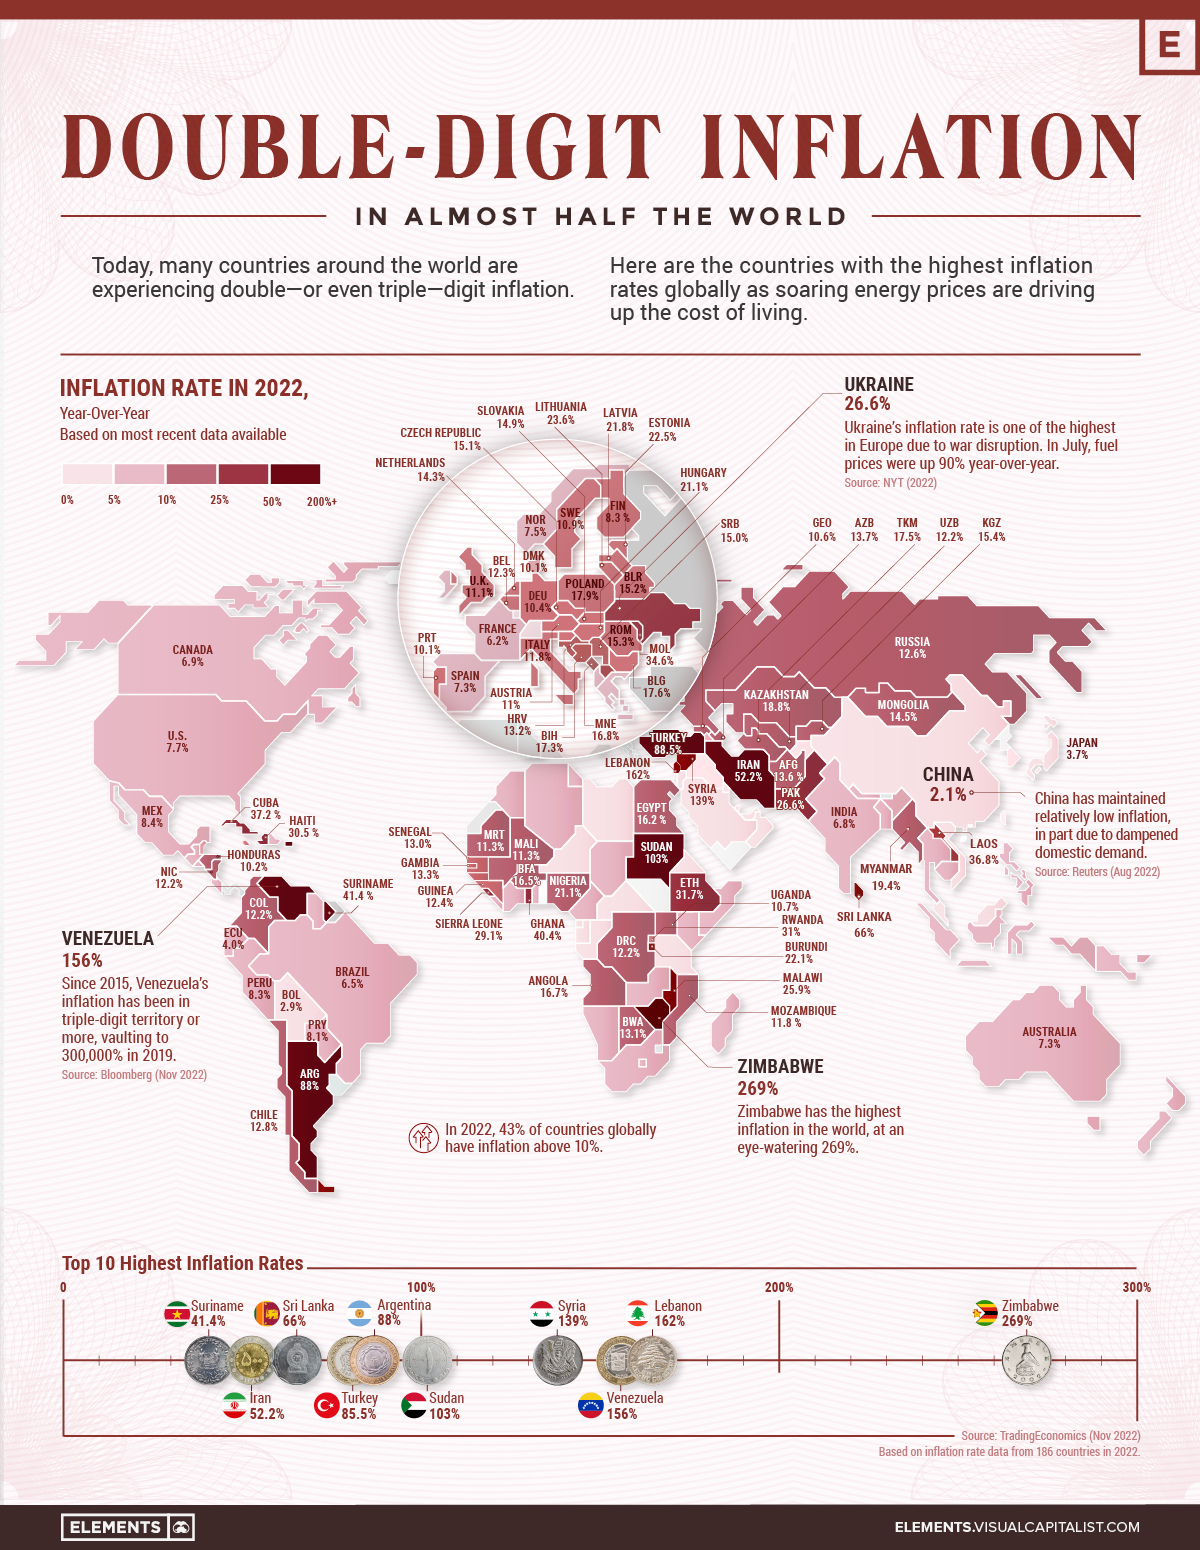
Inflation is surging nearly everywhere in 2022.
Geopolitical tensions are triggering high energy costs, while supply-side disruptions are also distorting consumer prices. The end result is that almost half of countries worldwide are seeing double-digit inflation rates or higher.
With new macroeconomic forces shaping the global economy, the above infographic shows countries with the highest inflation rates, using data from Trading Economics.
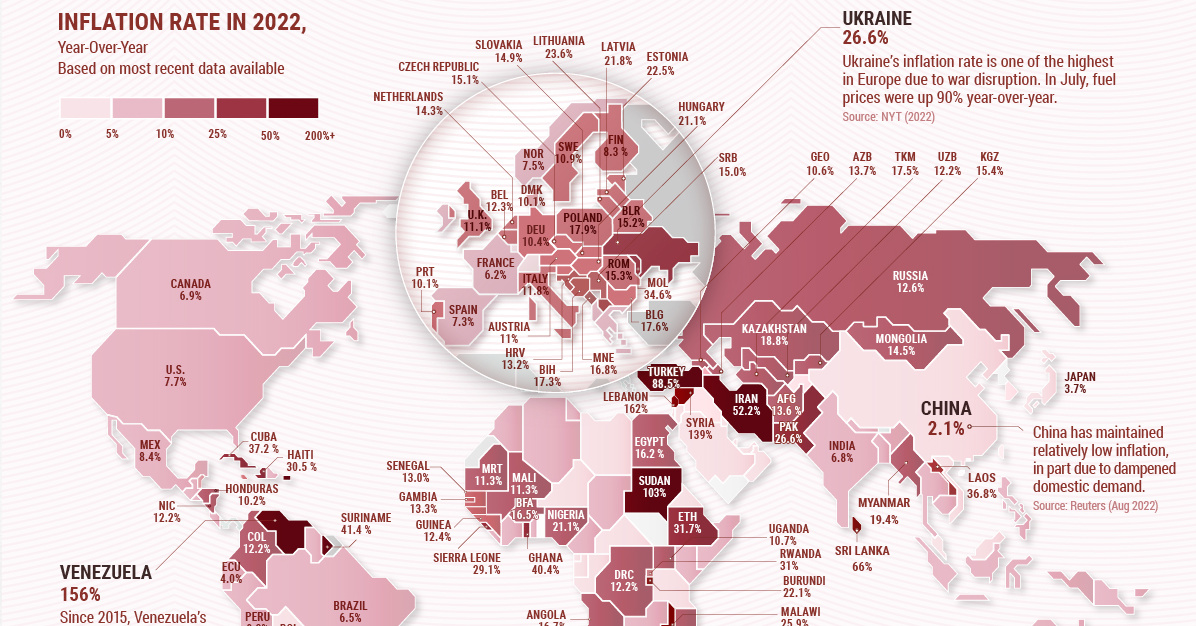
Double-Digit Inflation in 2022
As the table below shows, countless countries are navigating record-high levels of inflation. Some are even facing triple-digit inflation rates. Globally, Zimbabwe, Lebanon, and Venezuela have the highest rates in the world.
| Country | Inflation Rate, Year-Over-Year | Date |
|---|---|---|
| 🇿🇼 Zimbabwe | 269.0% | Oct 2022 |
| 🇱🇧 Lebanon | 162.0% | Sep 2022 |
| 🇻🇪 Venezuela | 156.0% | Oct 2022 |
| 🇸🇾 Syria | 139.0% | Aug 2022 |
| 🇸🇩 Sudan | 103.0% | Oct 2022 |
| 🇦🇷 Argentina | 88.0% | Oct 2022 |
| 🇹🇷 Turkey | 85.5% | Oct 2022 |
| 🇱🇰 Sri Lanka | 66.0% | Oct 2022 |
| 🇮🇷 Iran | 52.2% | Aug 2022 |
| 🇸🇷 Suriname | 41.4% | Sep 2022 |
| 🇬🇭 Ghana | 40.4% | Oct 2022 |
| 🇨🇺 Cuba | 37.2% | Sep 2022 |
| 🇱🇦 Laos | 36.8% | Oct 2022 |
| 🇲🇩 Moldova | 34.6% | Oct 2022 |
| 🇪🇹 Ethiopia | 31.7% | Oct 2022 |
| 🇷🇼 Rwanda | 31.0% | Oct 2022 |
| 🇭🇹 Haiti | 30.5% | Jul 2022 |
| 🇸🇱 Sierra Leone | 29.1% | Sep 2022 |
| 🇵🇰 Pakistan | 26.6% | Oct 2022 |
| 🇺🇦 Ukraine | 26.6% | Oct 2022 |
| 🇲🇼 Malawi | 25.9% | Sep 2022 |
| 🇱🇹 Lithuania | 23.6% | Oct 2022 |
| 🇪🇪 Estonia | 22.5% | Oct 2022 |
| 🇧🇮 Burundi | 22.1% | Oct 2022 |
| 🇸🇹 Sao Tome and Principe | 21.9% | Sep 2022 |
| 🇱🇻 Latvia | 21.8% | Oct 2022 |
| 🇭🇺 Hungary | 21.1% | Oct 2022 |
| 🇳🇬 Nigeria | 21.1% | Oct 2022 |
| 🇲🇰 Macedonia | 19.8% | Oct 2022 |
| 🇲🇲 Myanmar | 19.4% | Jun 2022 |
| 🇰🇿 Kazakhstan | 18.8% | Oct 2022 |
| 🇵🇱 Poland | 17.9% | Oct 2022 |
| 🇧🇬 Bulgaria | 17.6% | Oct 2022 |
| 🇹🇲 Turkmenistan | 17.5% | Dec 2021 |
| 🇧🇦 Bosnia and Herzegovina | 17.3% | Sep 2022 |
| 🇲🇪 Montenegro | 16.8% | Oct 2022 |
| 🇦🇴 Angola | 16.7% | Oct 2022 |
| 🇧🇫 Burkina Faso | 16.5% | Sep 2022 |
| 🇪🇬 Egypt | 16.2% | Oct 2022 |
| 🇰🇲 Comoros | 15.9% | Sep 2022 |
| 🇰🇬 Kyrgyzstan | 15.4% | Oct 2022 |
| 🇷🇴 Romania | 15.3% | Oct 2022 |
| 🇧🇾 Belarus | 15.2% | Oct 2022 |
| 🇨🇿 Czech Republic | 15.1% | Oct 2022 |
| 🇷🇸 Serbia | 15.0% | Oct 2022 |
| 🇸🇰 Slovakia | 14.9% | Oct 2022 |
| 🇲🇳 Mongolia | 14.5% | Oct 2022 |
| 🇳🇱 Netherlands | 14.3% | Oct 2022 |
| 🇦🇿 Azerbaijan | 13.7% | Oct 2022 |
| 🇦🇫 Afghanistan | 13.6% | Sep 2022 |
| 🇬🇲 Gambia | 13.3% | Sep 2022 |
| 🇭🇷 Croatia | 13.2% | Oct 2022 |
| 🇧🇼 Botswana | 13.1% | Oct 2022 |
| 🇸🇳 Senegal | 13.0% | Oct 2022 |
| 🇨🇱 Chile | 12.8% | Oct 2022 |
| 🇽🇰 Kosovo | 12.7% | Oct 2022 |
| 🇷🇺 Russia | 12.6% | Oct 2022 |
| 🇬🇳 Guinea | 12.4% | Jul 2022 |
| 🇧🇪 Belgium | 12.3% | Oct 2022 |
| 🇨🇴 Colombia | 12.2% | Oct 2022 |
| 🇺🇿 Uzbekistan | 12.2% | Oct 2022 |
| 🇨🇬 Congo | 12.2% | Oct 2022 |
| 🇳🇮 Nicaragua | 12.2% | Oct 2022 |
| 🇰🇾 Cayman Islands | 12.1% | Jun 2022 |
| 🇲🇺 Mauritius | 11.9% | Oct 2022 |
| 🇲🇿 Mozambique | 11.8% | Oct 2022 |
| 🇮🇹 Italy | 11.8% | Oct 2022 |
| 🇲🇱 Mali | 11.3% | Sep 2022 |
| 🇲🇷 Mauritania | 11.3% | Sep 2022 |
| 🇬🇧 United Kingdom | 11.1% | Oct 2022 |
| 🇦🇹 Austria | 11.0% | Oct 2022 |
| 🇸🇪 Sweden | 10.9% | Oct 2022 |
| 🇺🇬 Uganda | 10.7% | Oct 2022 |
| 🇬🇪 Georgia | 10.6% | Oct 2022 |
| 🇩🇪 Germany | 10.4% | Oct 2022 |
| 🇭🇳 Honduras | 10.2% | Oct 2022 |
| 🇩🇰 Denmark | 10.1% | Oct 2022 |
| 🇵🇹 Portugal | 10.1% | Oct 2022 |
| 🇯🇲 Jamaica | 9.9% | Oct 2022 |
| 🇸🇮 Slovenia | 9.9% | Oct 2022 |
| 🇬🇹 Guatemala | 9.7% | Oct 2022 |
| 🇿🇲 Zambia | 9.7% | Oct 2022 |
| 🇰🇪 Kenya | 9.6% | Oct 2022 |
| 🇦🇲 Armenia | 9.5% | Oct 2022 |
| 🇮🇸 Iceland | 9.4% | Oct 2022 |
| 🇲🇬 Madagascar | 9.3% | Aug 2022 |
| 🇮🇪 Ireland | 9.2% | Oct 2022 |
| 🇱🇸 Lesotho | 9.2% | Sep 2022 |
| 🇹🇳 Tunisia | 9.2% | Oct 2022 |
| 🇬🇷 Greece | 9.1% | Oct 2022 |
| 🇺🇾 Uruguay | 9.1% | Oct 2022 |
| 🇨🇷 Costa Rica | 9.0% | Oct 2022 |
| 🇧🇩 Bangladesh | 8.9% | Oct 2022 |
| 🇨🇾 Cyprus | 8.8% | Oct 2022 |
| 🇫🇴 Faroe Islands | 8.8% | Sep 2022 |
| 🇩🇿 Algeria | 8.7% | Sep 2022 |
| 🇳🇵 Nepal | 8.6% | Sep 2022 |
| 🇸🇧 Solomon Islands | 8.5% | Aug 2022 |
| 🇲🇽 Mexico | 8.4% | Oct 2022 |
| 🇬🇼 Guinea Bissau | 8.4% | Sep 2022 |
| 🇦🇱 Albania | 8.3% | Oct 2022 |
| 🇧🇧 Barbados | 8.3% | Aug 2022 |
| 🇫🇮 Finland | 8.3% | Oct 2022 |
| 🇲🇦 Morocco | 8.3% | Sep 2022 |
| 🇵🇪 Peru | 8.3% | Oct 2022 |
| 🇩🇴 Dominican Republic | 8.2% | Oct 2022 |
| 🇨🇻 Cape Verde | 8.2% | Oct 2022 |
| 🇵🇾 Paraguay | 8.1% | Oct 2022 |
| 🇹🇱 East Timor | 7.9% | Sep 2022 |
| 🇹🇬 Togo | 7.9% | Sep 2022 |
| 🇵🇭 Philippines | 7.7% | Oct 2022 |
| 🇺🇸 U.S. | 7.7% | Oct 2022 |
| 🇨🇲 Cameroon | 7.6% | Sep 2022 |
| 🇳🇴 Norway | 7.5% | Oct 2022 |
| 🇸🇬 Singapore | 7.5% | Sep 2022 |
| 🇿🇦 South Africa | 7.5% | Sep 2022 |
| 🇸🇻 El Salvador | 7.5% | Oct 2022 |
| 🇲🇹 Malta | 7.4% | Oct 2022 |
| 🇦🇺 Australia | 7.3% | Sep 2022 |
| 🇪🇸 Spain | 7.3% | Oct 2022 |
| 🇹🇩 Chad | 7.2% | Sep 2022 |
| 🇳🇿 New Zealand | 7.2% | Sep 2022 |
| 🇧🇿 Belize | 7.1% | Sep 2022 |
| 🇳🇦 Namibia | 7.1% | Oct 2022 |
| 🇦🇼 Aruba | 7.0% | Sep 2022 |
| 🇨🇦 Canada | 6.9% | Oct 2022 |
| 🇱🇺 Luxembourg | 6.9% | Oct 2022 |
| 🇸🇴 Somalia | 6.9% | Oct 2022 |
| 🇮🇳 India | 6.8% | Oct 2022 |
| 🇦🇪 United Arab Emirates | 6.8% | Jun 2022 |
| 🇬🇾 Guyana | 6.5% | Sep 2022 |
| 🇱🇷 Liberia | 6.5% | Jul 2022 |
| 🇧🇷 Brazil | 6.5% | Oct 2022 |
| 🇧🇸 Bahamas | 6.3% | Aug 2022 |
| 🇨🇮 Ivory Coast | 6.3% | Sep 2022 |
| 🇹🇹 Trinidad and Tobago | 6.3% | Aug 2022 |
| 🇫🇷 France | 6.2% | Oct 2022 |
| 🇩🇯 Djibouti | 6.1% | Sep 2022 |
| 🇵🇷 Puerto Rico | 6.1% | Sep 2022 |
| 🇧🇹 Bhutan | 6.1% | Sep 2022 |
| 🇧🇹 Qatar | 6.0% | Sep 2022 |
| 🇹🇭 Thailand | 6.0% | Oct 2022 |
| 🇸🇿 Swaziland | 5.8% | Aug 2022 |
| 🇮🇩 Indonesia | 5.7% | Oct 2022 |
| 🇰🇷 South Korea | 5.7% | Oct 2022 |
| 🇹🇯 Tajikistan | 5.7% | Sep 2022 |
| 🇵🇬 Papua New Guinea | 5.5% | Jun 2022 |
| 🇰🇭 Cambodia | 5.4% | Jul 2022 |
| 🇮🇶 Iraq | 5.3% | Sep 2022 |
| 🇯🇴 Jordan | 5.2% | Oct 2022 |
| 🇫🇯 Fiji | 5.1% | Sep 2022 |
| 🇮🇱 Israel | 5.1% | Oct 2022 |
| 🇳🇨 New Caledonia | 5.0% | Sep 2022 |
| 🇹🇿 Tanzania | 4.9% | Oct 2022 |
| 🇧🇲 Bermuda | 4.5% | Jul 2022 |
| 🇪🇷 Eritrea | 4.5% | Dec 2021 |
| 🇲🇾 Malaysia | 4.5% | Sep 2022 |
| 🇭🇰 Hong Kong | 4.4% | Sep 2022 |
| 🇵🇸 Palestine | 4.4% | Oct 2022 |
| 🇧🇳 Brunei | 4.3% | Sep 2022 |
| 🇱🇾 Libya | 4.3% | Sep 2022 |
| 🇻🇳 Vietnam | 4.3% | Oct 2022 |
| 🇪🇨 Ecuador | 4.0% | Oct 2022 |
| 🇧🇭 Bahrain | 4.0% | Sep 2022 |
| 🇯🇵 Japan | 3.7% | Oct 2022 |
| 🇰🇼 Kuwait | 3.2% | Sep 2022 |
| 🇳🇪 Niger | 3.2% | Sep 2022 |
| 🇲🇻 Maldives | 3.1% | Sep 2022 |
| 🇬🇦 Gabon | 3.0% | Jul 2022 |
| 🇱🇮 Liechtenstein | 3.0% | Oct 2022 |
| 🇸🇦 Saudi Arabia | 3.0% | Oct 2022 |
| 🇨🇭 Switzerland | 3.0% | Oct 2022 |
| 🇸🇨 Seychelles | 2.9% | Oct 2022 |
| 🇬🇶 Equatorial Guinea | 2.9% | Dec 2021 |
| 🇧🇴 Bolivia | 2.9% | Oct 2022 |
| 🇹🇼 Taiwan | 2.7% | Oct 2022 |
| 🇨🇫 Central African Republic | 2.7% | Dec 2021 |
| 🇻🇺 Vanuatu | 2.7% | Mar 2022 |
| 🇴🇲 Oman | 2.4% | Sep 2022 |
| 🇧🇯 Benin | 2.1% | Oct 2022 |
| 🇨🇳 China | 2.1% | Oct 2022 |
| 🇵🇦 Panama | 1.9% | Sep 2022 |
| 🇲🇴 Macau | 1.1% | Sep 2022 |
| 🇸🇸 South Sudan | -2.5% | Aug 2022 |
*Inflation rates based on the latest available data.
As price pressures mount, 33 central banks tracked by the Bank of International Settlements (out of a total of 38) have raised interest rates this year. These coordinated rate hikes are the largest in two decades, representing an end to an era of rock-bottom interest rates.
Going into 2023, central banks could continue this shift towards hawkish policies as inflation remains aggressively high.
The Role of Energy Prices
Driven by the war in Ukraine, energy inflation is pushing up the cost of living around the world.
Since October 2020, an index of global energy prices—made up of crude oil, natural gas, coal, and propane—has increased drastically.
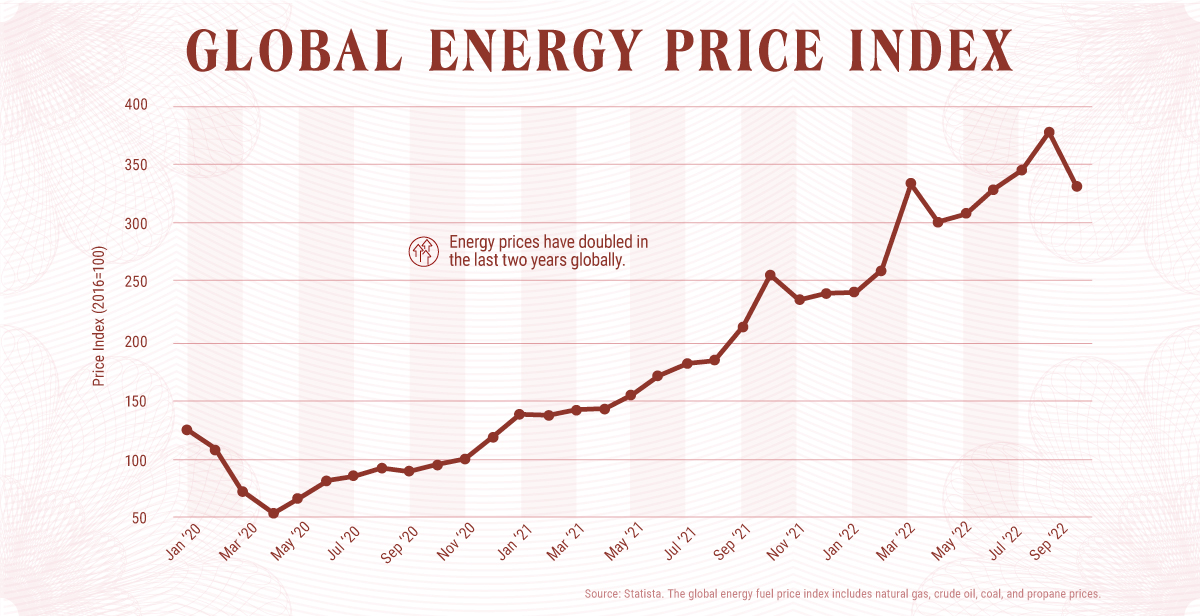
Compared to the 2021 average, natural gas prices in Europe are up sixfold. Real European household electricity prices are up 78% and gas prices have climbed even more, at 144% compared to 20-year averages.
Amid global competition for liquefied natural gas supplies, price pressures are likely to stay high, even though they have fallen recently. Other harmful consequences of the energy shock include price volatility, economic strain, and energy shortages.
“The world is in the midst of the first truly global energy crisis, with impacts that will be felt for years to come”.
-Fatih Birol, executive director of the IEA
Double-Digit Inflation: Will it Last?
If history is an example, taming rising prices could take at least a few years yet.
Take the sky-high inflation of the 1980s. Italy, which managed to combat inflation faster than most countries, brought down inflation from 22% in 1980 to 4% in 1986.
If global inflation rates, which hover around 9.8% in 2022, were to follow this course, it would take at least until 2025 for levels to reach the 2% target.
It’s worth noting that inflation was also highly volatile over this decade. Consider how inflation fell across much of the rich world by 1981 but shot up again in 1987 amid higher energy prices. Federal Reserve chair Jerome Powell spoke to the volatility of inflation at their November meeting, indicating that high inflation has a chance of following a period of low inflation.
While the Federal Reserve projects U.S. inflation to fall closer to its 2% target by 2024, the road ahead could still get a lot bumpier between now and then.


Money
Charted: Which City Has the Most Billionaires in 2024?
Just two countries account for half of the top 20 cities with the most billionaires. And the majority of the other half are found in Asia.


Charted: Which Country Has the Most Billionaires in 2024?
This was originally posted on our Voronoi app. Download the app for free on iOS or Android and discover incredible data-driven charts from a variety of trusted sources.
Some cities seem to attract the rich. Take New York City for example, which has 340,000 high-net-worth residents with investable assets of more than $1 million.
But there’s a vast difference between being a millionaire and a billionaire. So where do the richest of them all live?
Using data from the Hurun Global Rich List 2024, we rank the top 20 cities with the highest number of billionaires in 2024.
A caveat to these rich lists: sources often vary on figures and exact rankings. For example, in last year’s reports, Forbes had New York as the city with the most billionaires, while the Hurun Global Rich List placed Beijing at the top spot.
Ranked: Top 20 Cities with the Most Billionaires in 2024
The Chinese economy’s doldrums over the course of the past year have affected its ultra-wealthy residents in key cities.
Beijing, the city with the most billionaires in 2023, has not only ceded its spot to New York, but has dropped to #4, overtaken by London and Mumbai.
| Rank | City | Billionaires | Rank Change YoY |
|---|---|---|---|
| 1 | 🇺🇸 New York | 119 | +1 |
| 2 | 🇬🇧 London | 97 | +3 |
| 3 | 🇮🇳 Mumbai | 92 | +4 |
| 4 | 🇨🇳 Beijing | 91 | -3 |
| 5 | 🇨🇳 Shanghai | 87 | -2 |
| 6 | 🇨🇳 Shenzhen | 84 | -2 |
| 7 | 🇭🇰 Hong Kong | 65 | -1 |
| 8 | 🇷🇺 Moscow | 59 | No Change |
| 9 | 🇮🇳 New Delhi | 57 | +6 |
| 10 | 🇺🇸 San Francisco | 52 | No Change |
| 11 | 🇹🇭 Bangkok | 49 | +2 |
| 12 | 🇹🇼 Taipei | 45 | +2 |
| 13 | 🇫🇷 Paris | 44 | -2 |
| 14 | 🇨🇳 Hangzhou | 43 | -5 |
| 15 | 🇸🇬 Singapore | 42 | New to Top 20 |
| 16 | 🇨🇳 Guangzhou | 39 | -4 |
| 17T | 🇮🇩 Jakarta | 37 | +1 |
| 17T | 🇧🇷 Sao Paulo | 37 | No Change |
| 19T | 🇺🇸 Los Angeles | 31 | No Change |
| 19T | 🇰🇷 Seoul | 31 | -3 |
In fact all Chinese cities on the top 20 list have lost billionaires between 2023–24. Consequently, they’ve all lost ranking spots as well, with Hangzhou seeing the biggest slide (-5) in the top 20.
Where China lost, all other Asian cities—except Seoul—in the top 20 have gained ranks. Indian cities lead the way, with New Delhi (+6) and Mumbai (+3) having climbed the most.
At a country level, China and the U.S combine to make up half of the cities in the top 20. They are also home to about half of the world’s 3,200 billionaire population.
In other news of note: Hurun officially counts Taylor Swift as a billionaire, estimating her net worth at $1.2 billion.

-

 Science1 week ago
Visualizing the Average Lifespans of Mammals
-

 Markets2 weeks ago
The Top 10 States by Real GDP Growth in 2023
-

 Demographics2 weeks ago
The Smallest Gender Wage Gaps in OECD Countries
-

 United States2 weeks ago
Where U.S. Inflation Hit the Hardest in March 2024
-

 Green2 weeks ago
Top Countries By Forest Growth Since 2001
-

 United States2 weeks ago
Ranked: The Largest U.S. Corporations by Number of Employees
-

 Maps2 weeks ago
The Largest Earthquakes in the New York Area (1970-2024)
-

 Green2 weeks ago
Ranked: The Countries With the Most Air Pollution in 2023