Money
Visualized: The Security Features of American Money


Visualized: The Security Features of American Money
In 1739, Benjamin Franklin sought to tackle the issue of counterfeit money in America, using a printing press and leaves to create unique raised patterns on the colonial notes.
Almost 300 years later, Benjamin Franklin is the face of the U.S. $100 bill, and it is protected by a myriad of security features including secret images, special ink, hidden watermarks, and magnetic signatures, among others.
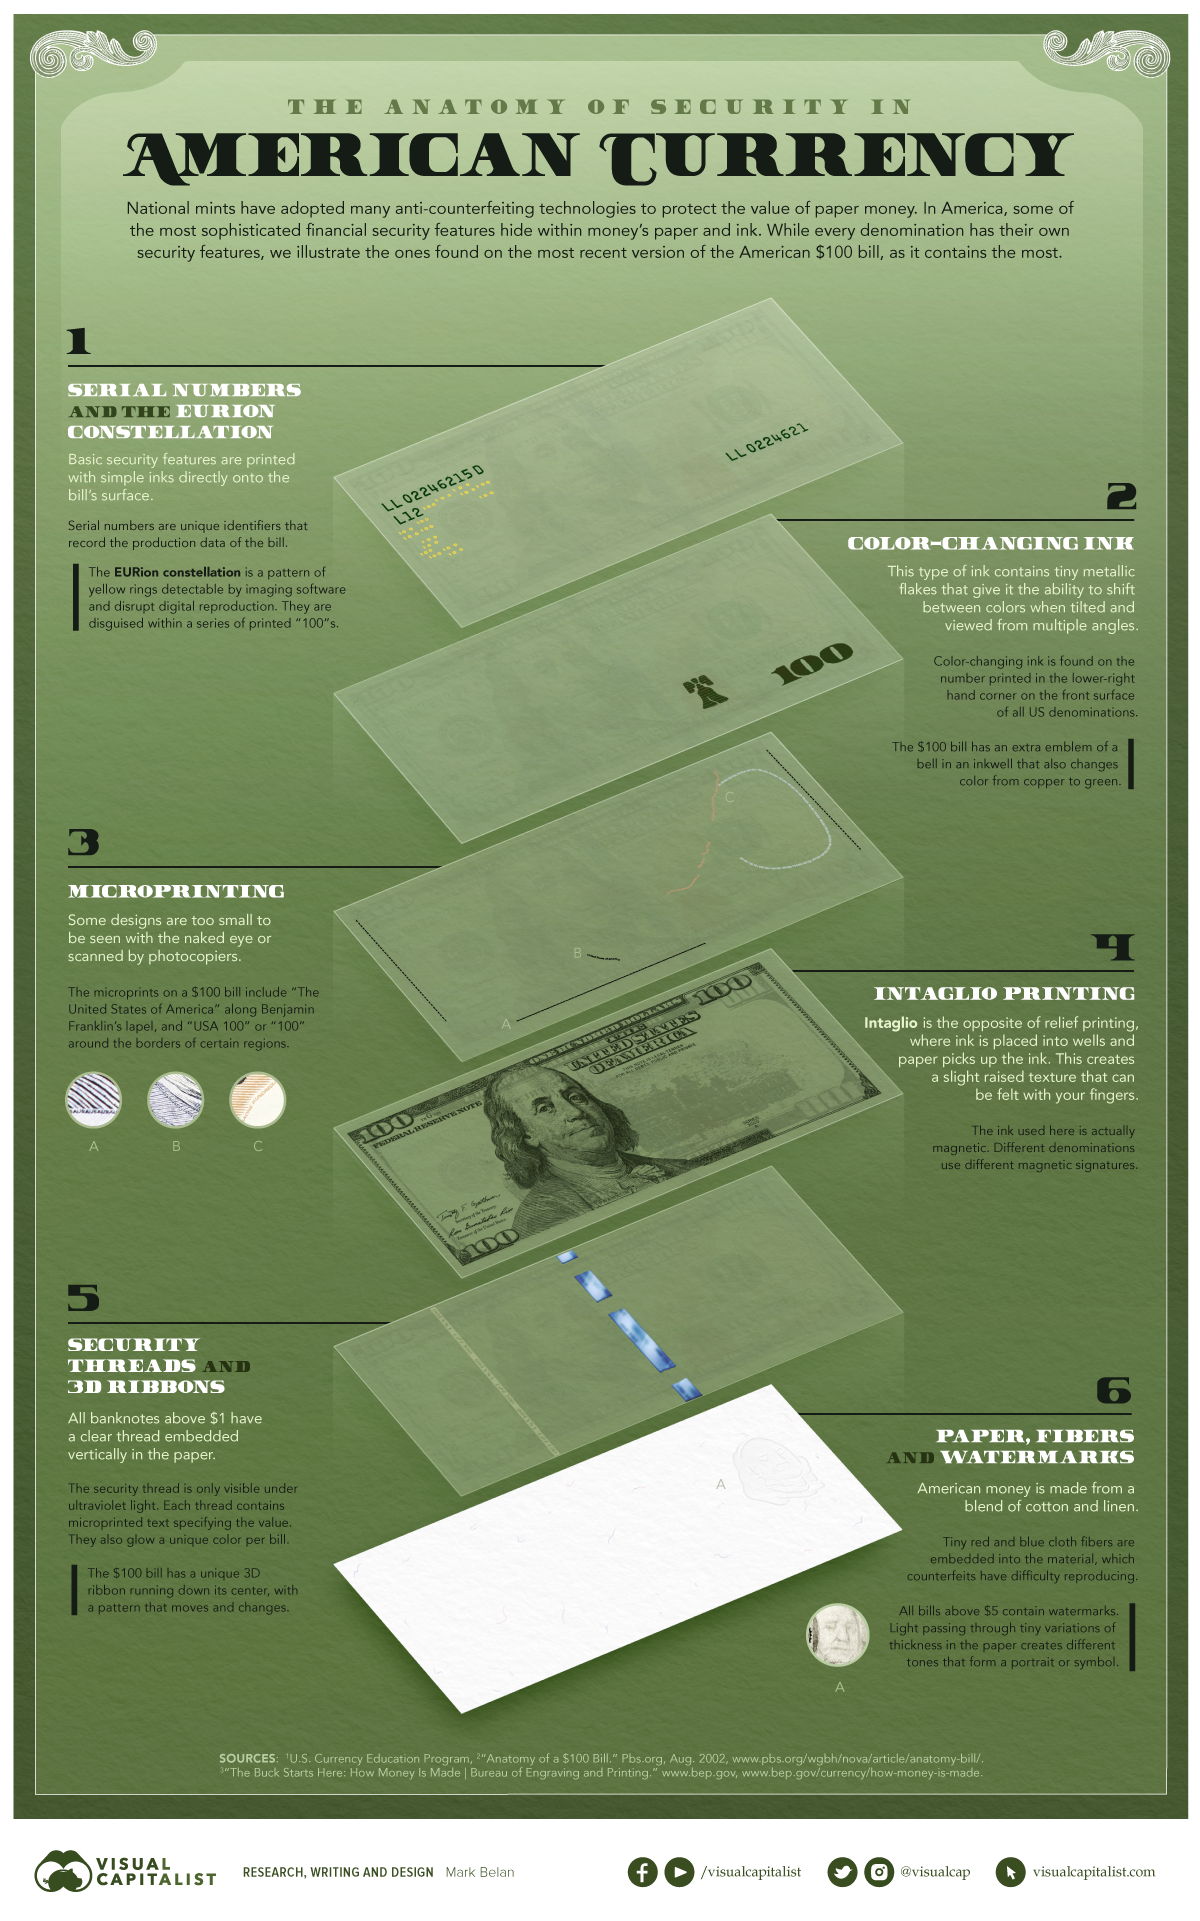
In this visual, we’ve broken down the $100 bill to showcase the anatomy of American currency.
The Makeup of American Money
There are 6 key features that identify real bills and protect the falsification of American money.
① Serial Numbers & EURion Constellation
The most basic form of security on an $100 bill is the serial number. Every bill has a unique number to record data on its production and keep track of how many individual bills are in circulation.
The EURion constellation is star-like grouping of yellow rings near the serial number. It is only detectable by imaging software.
② Color Changing Ink
This ink changes color at different angles thanks to small metallic flakes within the ink itself. The $100 bill, like all other paper bills in the U.S., has its value denoted in color changing ink on the bottom right-hand corner; unlike other bills, it also features a liberty bell image using the ink.
③ Microprinting
Microprinting allows for verifiable images that cannot be scanned by photocopiers or seen by the naked eye. The $100 bill has phrases like “USA 100” written invisibly in multiple places.
④ Intaglio Printing
Rather than regular ink pressed onto the paper, intaglio printing uses magnetic ink and every different bill value has a unique magnetic signature.
⑤ Security Threads & 3D Ribbons
The security thread is a clear, embedded, vertical thread running through the bill. It can only be seen under UV light, contains microprinted text specifying the bill’s value, and on each different bill value it glows a unique color.
Additionally, 3D ribbons are placed in the center of $100 bills with a pattern that slightly changes as it moves.
⑥ Paper, Fibers, & Watermarks
Because American money is made of cotton and linen, blue and red cloth fibers are woven into the material as another identifying feature. Finally, watermarks are found on most bills and can only be detected by light passing through the bill.
The Relevance of Cash
Here’s a look at the total number of each paper bill that is physically in circulation in the U.S.:
| Physical Bill | Billions of notes (2021) |
|---|---|
| $1 | 14.0 |
| $2 | 1.4 |
| $5 | 3.4 |
| $10 | 2.3 |
| $20 | 11.9 |
| $50 | 2.5 |
| $100 | 17.7 |
| $500-$10,000 | 0.0004 |
| Total | 53.2 |
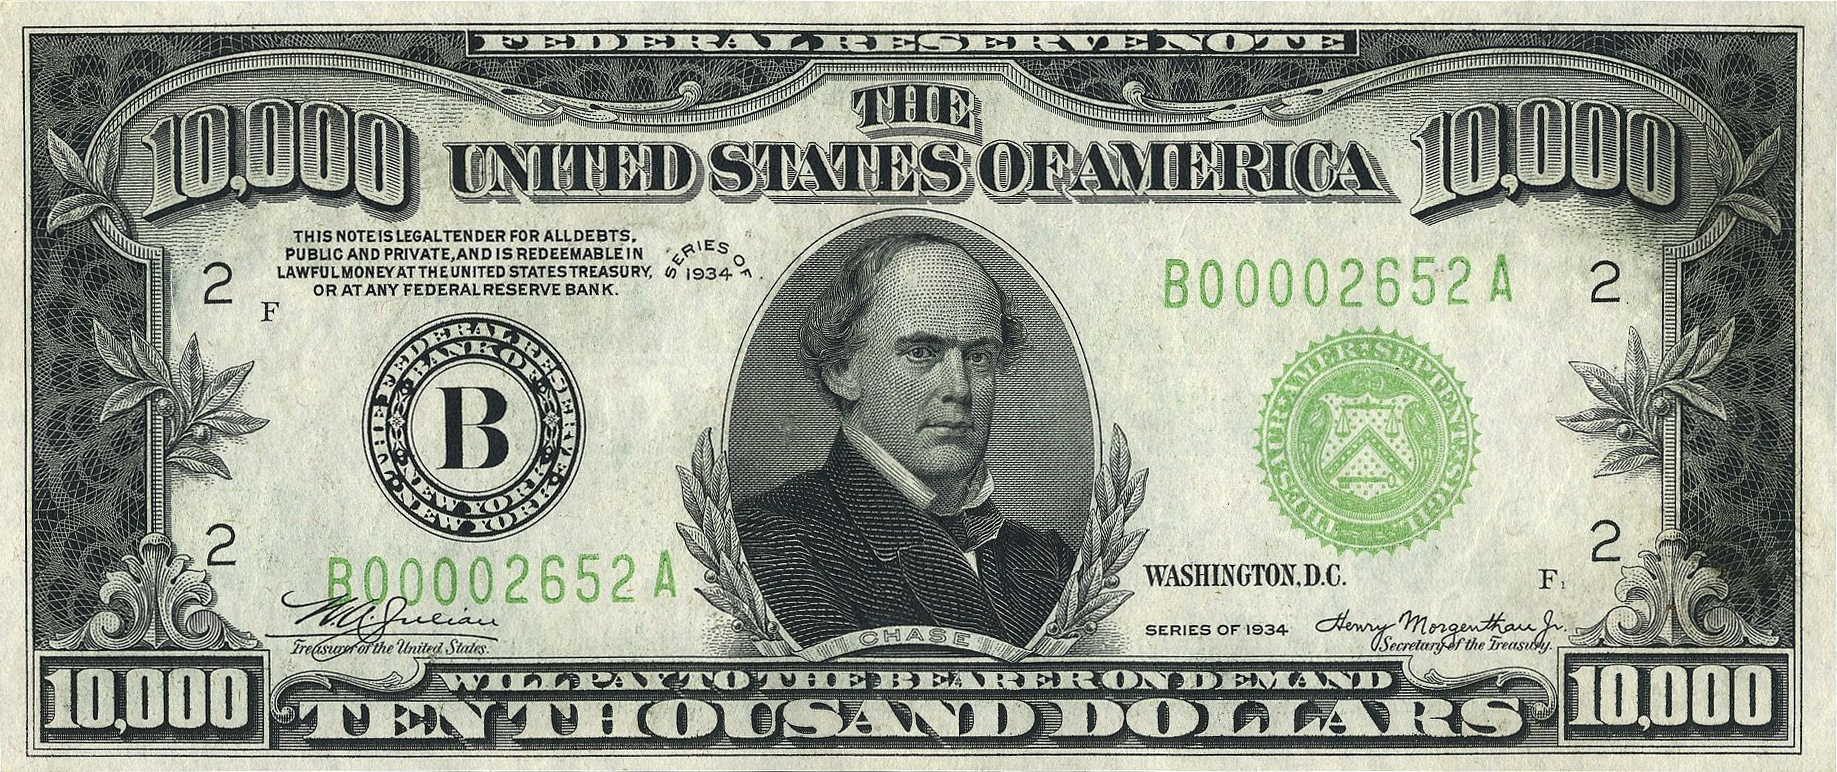
Interestingly, a number of $500-$10,000 dollar bills are in someone’s pockets. And while they are not issued anymore, the Fed still recognizes the originals of these bills that were legally put into circulation in the past.
Additionally, there is fake money passing hands in the U.S. economy. Being the most widely-accepted currency in the world, it’s no wonder many try to falsely replicate American money. According to the U.S. Department of Treasury, there are approximately $70 million in counterfeit bills currently circulating in the country.
Finally, a natural question arises: how many people still use cash anyways?
Well, a study from Pew Research Center found that it while it is a dwindling share of the population, around 58% of people still use cash for some to all of their weekly purchases, down from 70% in 2018 and 75% in 2015.


Money
Charted: Which City Has the Most Billionaires in 2024?
Just two countries account for half of the top 20 cities with the most billionaires. And the majority of the other half are found in Asia.


Charted: Which Country Has the Most Billionaires in 2024?
This was originally posted on our Voronoi app. Download the app for free on iOS or Android and discover incredible data-driven charts from a variety of trusted sources.
Some cities seem to attract the rich. Take New York City for example, which has 340,000 high-net-worth residents with investable assets of more than $1 million.
But there’s a vast difference between being a millionaire and a billionaire. So where do the richest of them all live?
Using data from the Hurun Global Rich List 2024, we rank the top 20 cities with the highest number of billionaires in 2024.
A caveat to these rich lists: sources often vary on figures and exact rankings. For example, in last year’s reports, Forbes had New York as the city with the most billionaires, while the Hurun Global Rich List placed Beijing at the top spot.
Ranked: Top 20 Cities with the Most Billionaires in 2024
The Chinese economy’s doldrums over the course of the past year have affected its ultra-wealthy residents in key cities.
Beijing, the city with the most billionaires in 2023, has not only ceded its spot to New York, but has dropped to #4, overtaken by London and Mumbai.
| Rank | City | Billionaires | Rank Change YoY |
|---|---|---|---|
| 1 | 🇺🇸 New York | 119 | +1 |
| 2 | 🇬🇧 London | 97 | +3 |
| 3 | 🇮🇳 Mumbai | 92 | +4 |
| 4 | 🇨🇳 Beijing | 91 | -3 |
| 5 | 🇨🇳 Shanghai | 87 | -2 |
| 6 | 🇨🇳 Shenzhen | 84 | -2 |
| 7 | 🇭🇰 Hong Kong | 65 | -1 |
| 8 | 🇷🇺 Moscow | 59 | No Change |
| 9 | 🇮🇳 New Delhi | 57 | +6 |
| 10 | 🇺🇸 San Francisco | 52 | No Change |
| 11 | 🇹🇭 Bangkok | 49 | +2 |
| 12 | 🇹🇼 Taipei | 45 | +2 |
| 13 | 🇫🇷 Paris | 44 | -2 |
| 14 | 🇨🇳 Hangzhou | 43 | -5 |
| 15 | 🇸🇬 Singapore | 42 | New to Top 20 |
| 16 | 🇨🇳 Guangzhou | 39 | -4 |
| 17T | 🇮🇩 Jakarta | 37 | +1 |
| 17T | 🇧🇷 Sao Paulo | 37 | No Change |
| 19T | 🇺🇸 Los Angeles | 31 | No Change |
| 19T | 🇰🇷 Seoul | 31 | -3 |
In fact all Chinese cities on the top 20 list have lost billionaires between 2023–24. Consequently, they’ve all lost ranking spots as well, with Hangzhou seeing the biggest slide (-5) in the top 20.
Where China lost, all other Asian cities—except Seoul—in the top 20 have gained ranks. Indian cities lead the way, with New Delhi (+6) and Mumbai (+3) having climbed the most.
At a country level, China and the U.S combine to make up half of the cities in the top 20. They are also home to about half of the world’s 3,200 billionaire population.
In other news of note: Hurun officially counts Taylor Swift as a billionaire, estimating her net worth at $1.2 billion.

-

 Science1 week ago
Visualizing the Average Lifespans of Mammals
-

 Markets2 weeks ago
The Top 10 States by Real GDP Growth in 2023
-

 Demographics2 weeks ago
The Smallest Gender Wage Gaps in OECD Countries
-

 United States2 weeks ago
Where U.S. Inflation Hit the Hardest in March 2024
-

 Green2 weeks ago
Top Countries By Forest Growth Since 2001
-

 United States2 weeks ago
Ranked: The Largest U.S. Corporations by Number of Employees
-

 Maps2 weeks ago
The Largest Earthquakes in the New York Area (1970-2024)
-

 Green2 weeks ago
Ranked: The Countries With the Most Air Pollution in 2023