

This graphic illustrates the amount of U.S. currency in circulation globally, by denomination, based on data from the Federal Reserve.


Euro, yen, and yuan—one is not like the other as we visualize the best and worst returns of the world's major currencies.


How much should you tip in each country for a restaurant, or a hotel? These maps show average tips in restaurants, hotels, and taxis.
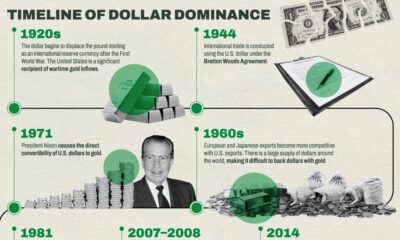

The U.S. dollar is the dominant currency in the global financial system, but some countries are following the trend of de-dollarization.


Globally, central banks bought a record 1,136 tonnes of gold in 2022. How has central bank gold demand changed over the last three decades?


Since 2008, the value of unrecorded dollar debt has doubled. Here's why this is increasing risk in global financial markets.


In a volatile and difficult year for many assets and equities, how have the world's major currencies performed against the U.S. dollar?


How can you tell a fake $100 bill from a real one? In this visual we break down the anatomy and security features of American money.


From the wealth held to billionaires to all debt in the global financial system, we look at the vast universe of money and markets in 2022.


Today, only 15% of banknotes feature women. This infographic looks at who these women are and which countries feature them on their currency


 Creator Program