Money
Visualizing $65 Trillion in Hidden Dollar Debt
Visualizing $65 Trillion in Hidden Dollar Debt
This was originally posted on Elements. Sign up to the free mailing list to get beautiful visualizations on natural resource megatrends in your email every week.
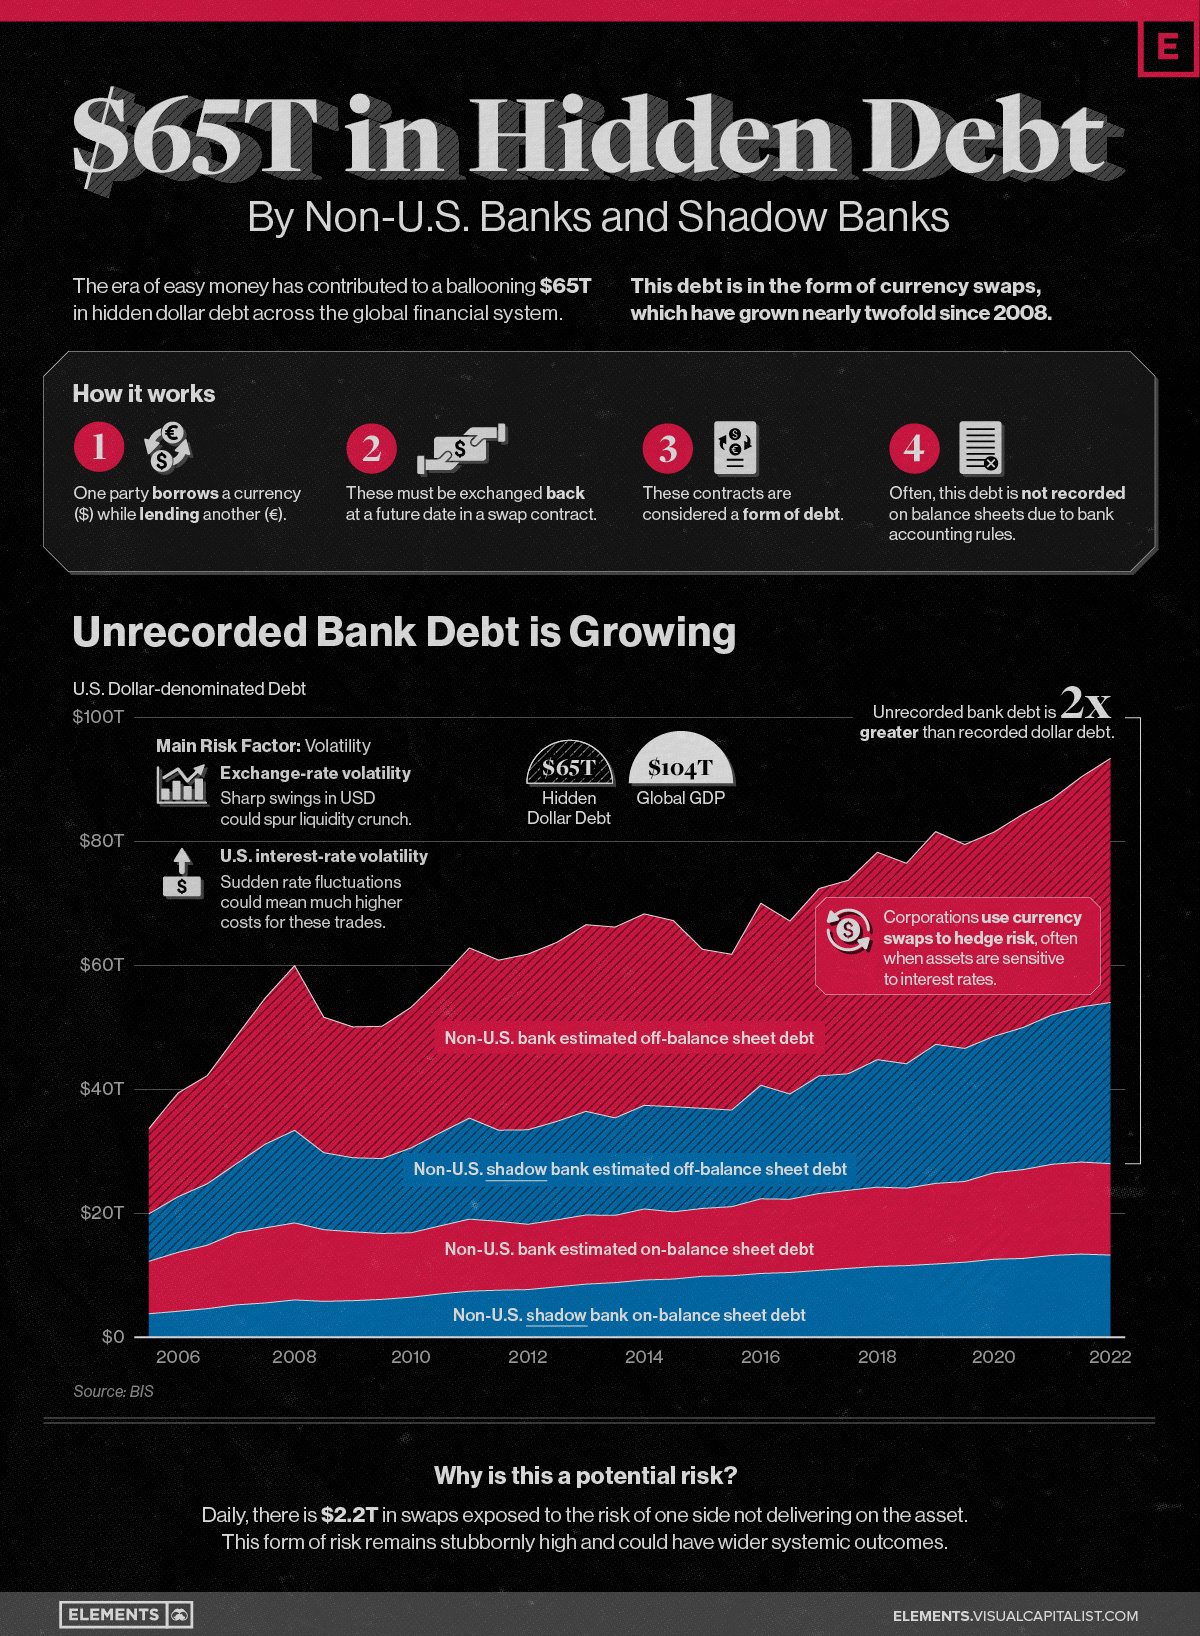
The scale of hidden dollar debt around the world is huge.
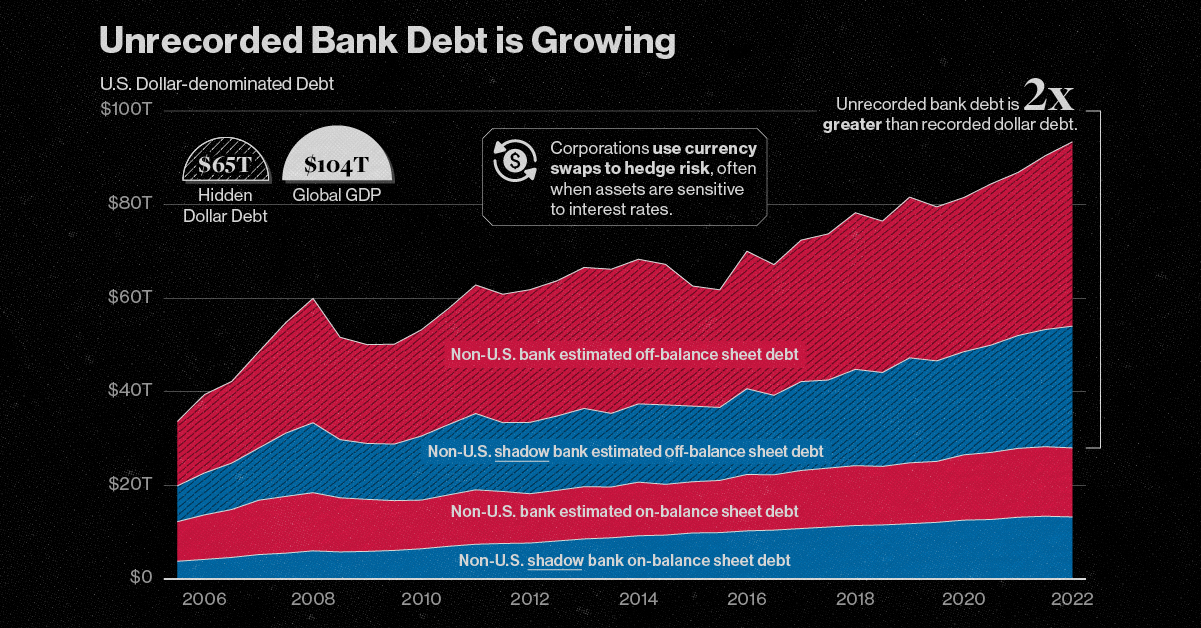
No less than $65 trillion in unrecorded dollar debt circulates across the global financial system in non-U.S. banks and shadow banks. To put in perspective, global GDP sits at $104 trillion.
This dollar debt is in the form of foreign-exchange swaps, which have exploded over the last decade due to years of monetary easing and ultra-low interest rates, as investors searched for higher yields. Today, unrecorded debt from these foreign-exchange swaps is worth more than double the dollar debt officially recorded on balance sheets across these institutions.
Based on analysis from the Bank of International Settlements (BIS), the above infographic charts the rise in hidden dollar debt across non-U.S. financial institutions and examines the wider implications of its growth.
Dollar Debt: A Beginners Guide
To start, we will briefly look at the role of foreign-exchange (forex) swaps in the global economy. The forex market is the largest in the world by a long stretch, with trillions traded daily.
Some of the key players that use foreign-exchange swaps are:
- Corporations
- Financial institutions
- Central banks
To understand forex swaps is to look at the role of currency risk. As we have seen in 2022, the U.S. dollar has been on a tear. When this happens, it hurts company earnings that generate revenue across borders. That’s because they earn revenue in foreign currencies (which have likely declined in value against the dollar) but end up converting earnings to U.S. dollars.
In order to reduce currency risk, market participants will buy forex swaps. Here, two parties agree to exchange one currency for another. In short, this helps protect the company from unfavorable foreign exchange rates.
What’s more, due to accounting rules, forex swaps are often unrecorded on balance sheets, and as a result are quite opaque.
A Mountain of Debt
Since 2008, the value of this opaque, unrecorded dollar debt has nearly doubled.
| Date | Non-U.S. Bank Unrecorded Debt | Non-U.S. Shadow Bank Unrecorded Debt |
|---|---|---|
| 2022* | $39.4T | $26.0T |
| 2021 | $37.1T | $25.0T |
| 2020 | $34.5T | $22.9T |
| 2019 | $32.9T | $21.5T |
| 2018 | $32.4T | $20.1T |
| 2017 | $31.2T | $18.8T |
| 2016 | $27.9T | $17.0T |
| 2015 | $25.1T | $15.6T |
| 2014 | $30.0T | $17.0T |
| 2013 | $30.8T | $15.7T |
| 2012 | $28.9T | $15.9T |
| 2011 | $27.5T | $14.7T |
| 2010 | $24.8T | $15.0T |
| 2009 | $21.4T | $12.1T |
| 2008 | $21.9T | $12.4T |
*As of June 30, 2022
Driving its rise in part was an era of rock-bottom interest rates globally. As investors sought out higher returns, they took on greater leverage—and forex swaps are one example of this.
Now, as interest rates have been rising, forex swaps have increased amid higher market volatility as investors look to hedge currency risk. This appears in both non-U.S. banks and non-U.S. shadow banks, which are unregulated financial intermediaries.
Overall, the value of unrecorded debt is staggering. An estimated $39 trillion is held by non-U.S. banks along with $26 trillion in overseas shadow banks around the world.
Past Case Studies
Why does the massive growth in dollar debt present risks?
During the market crashes of 2008 and 2020, forex swaps faced a funding squeeze. To borrow U.S. dollars, market participants had to pay high rates. A lot of this hinged on the impact of extreme volatility on these swaps, putting pressure on funding rates.
Here are two examples of how volatility can heighten risk in the forex market:
- Exchange-rate volatility: Sharp swings in USD can spur a liquidity crunch
- U.S. interest-rate volatility: Sudden rate fluctuations can mean much higher costs for these trades
In both cases, the U.S. central bank had to step in to provide liquidity in the market and prevent dollar shortages. This was done through pumping cash into the system and creating swap lines with other non-U.S. banks such as the Bank of Canada or the Bank of Japan. These were designed to protect from declining currency values and a liquidity crunch.
Dollar Debt: The Wider Implications
The risk from growing dollar debt and these swap lines arises when a non-U.S. bank or shadow bank may not be able to hold up their end of the agreement. In fact, on a daily basis, there is an estimated $2.2 trillion in forex swaps exposed to settlement risk.
Given its vast scale, this dollar debt could have greater systemic spillover effects. If participants fail to pay it could undermine financial market stability. Because demand for U.S. dollars increases during market uncertainty, a worsening economic climate could potentially expose the forex market to more vulnerabilities.


Money
Charted: Which City Has the Most Billionaires in 2024?
Just two countries account for half of the top 20 cities with the most billionaires. And the majority of the other half are found in Asia.


Charted: Which Country Has the Most Billionaires in 2024?
This was originally posted on our Voronoi app. Download the app for free on iOS or Android and discover incredible data-driven charts from a variety of trusted sources.
Some cities seem to attract the rich. Take New York City for example, which has 340,000 high-net-worth residents with investable assets of more than $1 million.
But there’s a vast difference between being a millionaire and a billionaire. So where do the richest of them all live?
Using data from the Hurun Global Rich List 2024, we rank the top 20 cities with the highest number of billionaires in 2024.
A caveat to these rich lists: sources often vary on figures and exact rankings. For example, in last year’s reports, Forbes had New York as the city with the most billionaires, while the Hurun Global Rich List placed Beijing at the top spot.
Ranked: Top 20 Cities with the Most Billionaires in 2024
The Chinese economy’s doldrums over the course of the past year have affected its ultra-wealthy residents in key cities.
Beijing, the city with the most billionaires in 2023, has not only ceded its spot to New York, but has dropped to #4, overtaken by London and Mumbai.
| Rank | City | Billionaires | Rank Change YoY |
|---|---|---|---|
| 1 | 🇺🇸 New York | 119 | +1 |
| 2 | 🇬🇧 London | 97 | +3 |
| 3 | 🇮🇳 Mumbai | 92 | +4 |
| 4 | 🇨🇳 Beijing | 91 | -3 |
| 5 | 🇨🇳 Shanghai | 87 | -2 |
| 6 | 🇨🇳 Shenzhen | 84 | -2 |
| 7 | 🇭🇰 Hong Kong | 65 | -1 |
| 8 | 🇷🇺 Moscow | 59 | No Change |
| 9 | 🇮🇳 New Delhi | 57 | +6 |
| 10 | 🇺🇸 San Francisco | 52 | No Change |
| 11 | 🇹🇭 Bangkok | 49 | +2 |
| 12 | 🇹🇼 Taipei | 45 | +2 |
| 13 | 🇫🇷 Paris | 44 | -2 |
| 14 | 🇨🇳 Hangzhou | 43 | -5 |
| 15 | 🇸🇬 Singapore | 42 | New to Top 20 |
| 16 | 🇨🇳 Guangzhou | 39 | -4 |
| 17T | 🇮🇩 Jakarta | 37 | +1 |
| 17T | 🇧🇷 Sao Paulo | 37 | No Change |
| 19T | 🇺🇸 Los Angeles | 31 | No Change |
| 19T | 🇰🇷 Seoul | 31 | -3 |
In fact all Chinese cities on the top 20 list have lost billionaires between 2023–24. Consequently, they’ve all lost ranking spots as well, with Hangzhou seeing the biggest slide (-5) in the top 20.
Where China lost, all other Asian cities—except Seoul—in the top 20 have gained ranks. Indian cities lead the way, with New Delhi (+6) and Mumbai (+3) having climbed the most.
At a country level, China and the U.S combine to make up half of the cities in the top 20. They are also home to about half of the world’s 3,200 billionaire population.
In other news of note: Hurun officially counts Taylor Swift as a billionaire, estimating her net worth at $1.2 billion.

-

 Education1 week ago
How Hard Is It to Get Into an Ivy League School?
-

 Technology2 weeks ago
Ranked: Semiconductor Companies by Industry Revenue Share
-

 Markets2 weeks ago
Ranked: The World’s Top Flight Routes, by Revenue
-

 Demographics2 weeks ago
Population Projections: The World’s 6 Largest Countries in 2075
-

 Markets2 weeks ago
The Top 10 States by Real GDP Growth in 2023
-

 Demographics2 weeks ago
The Smallest Gender Wage Gaps in OECD Countries
-

 Economy2 weeks ago
Where U.S. Inflation Hit the Hardest in March 2024
-

 Green2 weeks ago
Top Countries By Forest Growth Since 2001