Markets
Mapped: GDP Growth Forecasts by Country in 2024
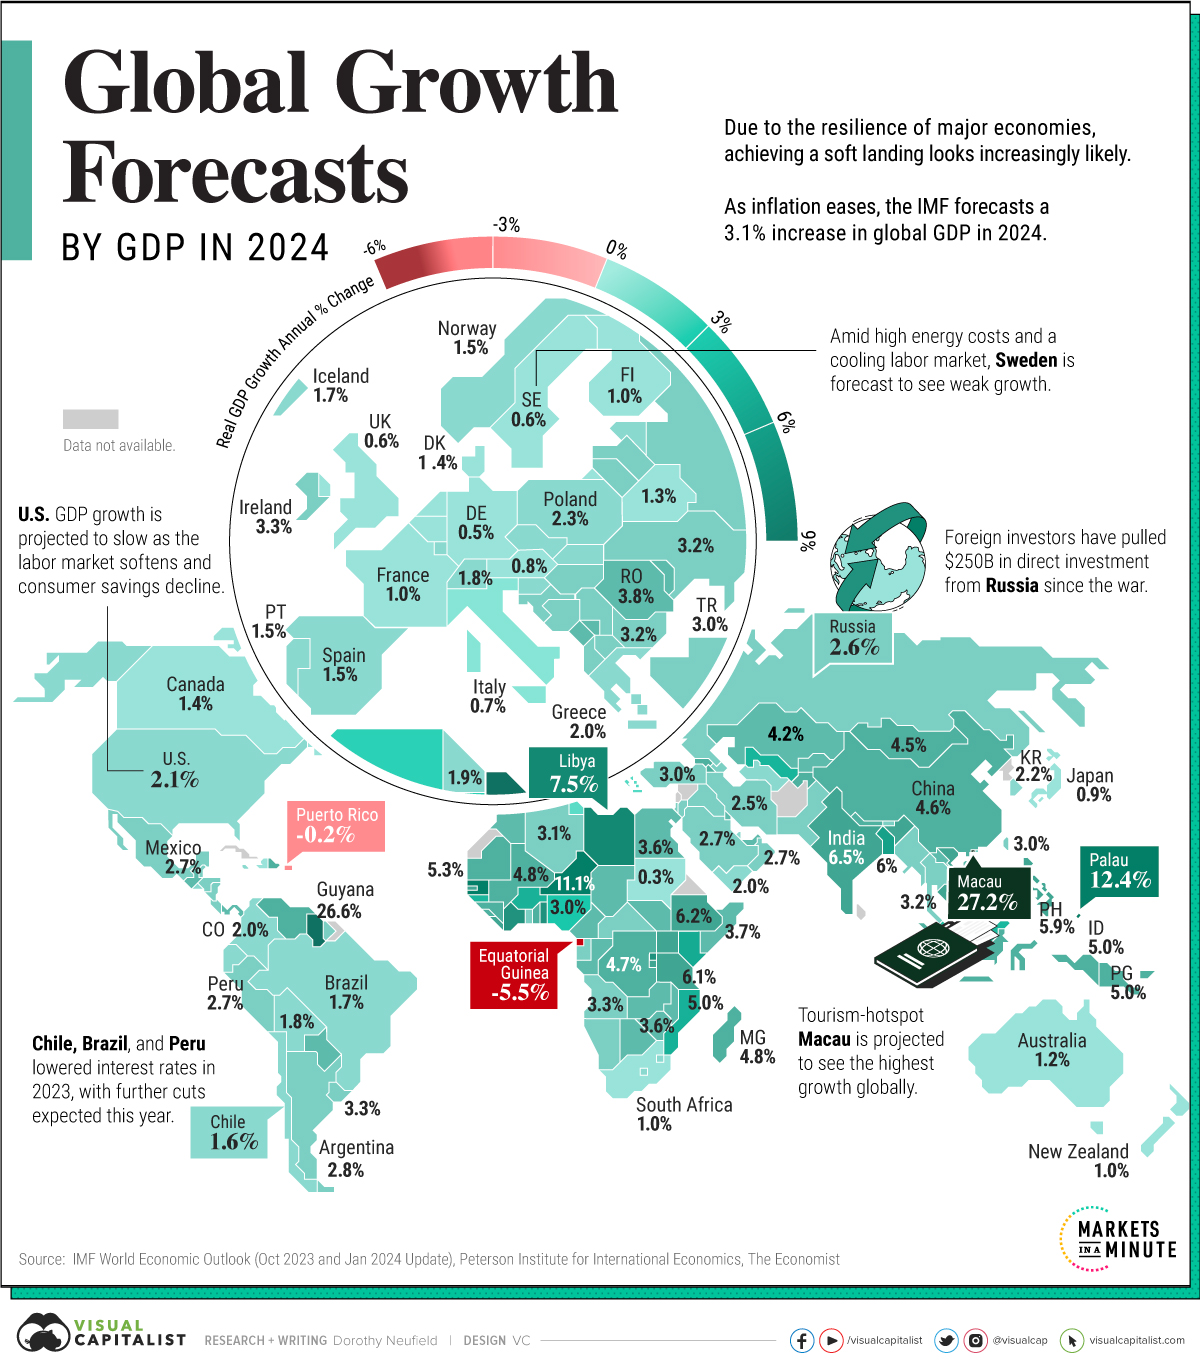
GDP Growth Forecasts in 2024
This was originally posted on Advisor Channel. Sign up to the free mailing list to get beautiful visualizations on financial markets that help advisors and their clients.
Resilient GDP growth and falling inflation are spurring a brighter outlook for 2024, although cautions remain across global economies.
While investors are hopeful that U.S. rate cuts could happen as early as May, the Fed has signaled that it won’t “declare victory” too soon. As countries around the world maneuver a complex landscape, they are faced with a scope of risks that include inflationary spikes, rising debt loads, and dwindling consumer savings.
This graphic shows global GDP growth projections in 2024, based on the International Monetary Fund (IMF) October 2023 Outlook and January 2024 update.
Global GDP Growth Outlook 2024
In 2024, real GDP growth is forecast to increase 3.1%, a slight rise from October’s outlook.
While positive growth is projected across all regions, it varies widely due to many factors spanning from the effects of higher borrowing costs to low consumer sentiment. Here are forecasts across 191 countries worldwide:
| Country | 2024 Real GDP % Change (Projected) | 2023 Real GDP % Change (Estimate) |
|---|---|---|
| 🇦🇱 Albania | 3.3% | 3.6% |
| 🇩🇿 Algeria | 3.1% | 3.8% |
| 🇦🇩 Andorra | 1.5% | 2.1% |
| 🇦🇴 Angola | 3.3% | 1.3% |
| 🇦🇬 Antigua and Barbuda | 5.4% | 5.6% |
| 🇦🇷 Argentina | 2.8% | -2.5% |
| 🇦🇲 Armenia | 5.0% | 7.0% |
| 🇦🇼 Aruba | 1.2% | 2.3% |
| 🇦🇺 Australia | 1.2% | 1.8% |
| 🇦🇹 Austria | 0.8% | 0.1% |
| 🇦🇿 Azerbaijan | 2.5% | 2.5% |
| 🇧🇸 The Bahamas | 1.8% | 2.7% |
| 🇧🇭 Bahrain | 3.6% | 6.0% |
| 🇧🇩 Bangladesh | 6.0% | 4.5% |
| 🇧🇧 Barbados | 3.9% | 1.6% |
| 🇧🇾 Belarus | 1.3% | 1.0% |
| 🇧🇪 Belgium | 0.9% | 4.0% |
| 🇧🇿 Belize | 3.0% | 5.5% |
| 🇧🇯 Benin | 6.3% | 5.3% |
| 🇧🇹 Bhutan | 3.0% | 1.8% |
| 🇧🇴 Bolivia | 1.8% | 2.0% |
| 🇧🇦 Bosnia and Herzegovina | 3.0% | 3.8% |
| 🇧🇼 Botswana | 4.1% | 3.1% |
| 🇧🇷 Brazil* | 1.7% | -0.8% |
| 🇧🇳 Brunei Darussalam | 3.5% | 1.7% |
| 🇧🇬 Bulgaria | 3.2% | 4.4% |
| 🇧🇫 Burkina Faso | 6.4% | 3.3% |
| 🇧🇮 Burundi | 6.0% | 4.4% |
| 🇨🇻 Cabo Verde | 4.5% | 5.6% |
| 🇰🇭 Cambodia | 6.1% | 4.0% |
| 🇨🇲 Cameroon | 4.2% | 1.3% |
| 🇨🇦 Canada* | 1.4% | 1.0% |
| 🇨🇫 Central African Republic | 2.5% | 4.0% |
| 🇹🇩 Chad | 3.7% | -0.5% |
| 🇨🇱 Chile | 1.6% | 5.0% |
| 🇨🇳 China* | 4.6% | 1.4% |
| 🇨🇴 Colombia | 2.0% | 3.0% |
| 🇰🇲 Comoros | 3.5% | 4.4% |
| 🇨🇩 Democratic Republic of the Congo | 4.7% | 2.7% |
| 🇨🇬 Republic of Congo | 4.4% | 6.2% |
| 🇨🇷 Costa Rica | 3.2% | 2.2% |
| 🇨🇮 Côte d'Ivoire | 6.6% | 0.2% |
| 🇭🇷 Croatia | 2.6% | 6.7% |
| 🇨🇾 Cyprus | 2.7% | 1.7% |
| 🇨🇿 Czech Republic | 2.3% | 5.0% |
| 🇩🇰 Denmark | 1.4% | 4.6% |
| 🇩🇯 Djibouti | 6.0% | 3.0% |
| 🇩🇲 Dominica | 4.6% | 1.4% |
| 🇩🇴 Dominican Republic | 5.2% | 4.2% |
| 🇪🇨 Ecuador | 1.8% | 2.2% |
| 🇪🇬 Egypt | 3.6% | -6.2% |
| 🇸🇻 El Salvador | 1.9% | -2.3% |
| 🇬🇶 Equatorial Guinea | -5.5% | 3.1% |
| 🇪🇪 Estonia | 2.4% | 6.1% |
| 🇸🇿 Eswatini | 3.3% | 7.5% |
| 🇪🇹 Ethiopia | 6.2% | -0.1% |
| 🇫🇯 Fiji | 3.9% | 1.0% |
| 🇫🇮 Finland | 1.0% | 2.8% |
| 🇫🇷 France* | 1.0% | 6.2% |
| 🇬🇦 Gabon | 2.6% | -0.5% |
| 🇬🇲 The Gambia | 6.2% | 1.2% |
| 🇬🇪 Georgia | 4.8% | 2.5% |
| 🇩🇪 Germany* | 0.5% | 3.9% |
| 🇬🇭 Ghana | 2.7% | 3.4% |
| 🇬🇷 Greece | 2.0% | 5.9% |
| 🇬🇩 Grenada | 3.8% | 4.5% |
| 🇬🇹 Guatemala | 3.5% | 38.4% |
| 🇬🇳 Guinea | 5.6% | -1.5% |
| 🇬🇼 Guinea-Bissau | 5.0% | 2.9% |
| 🇬🇾 Guyana | 26.6% | 4.4% |
| 🇭🇹 Haiti | 1.4% | -0.3% |
| 🇭🇳 Honduras | 3.2% | 3.3% |
| 🇭🇰 Hong Kong SAR | 2.9% | 6.3% |
| 🇭🇺 Hungary | 3.1% | 5.0% |
| 🇮🇸 Iceland | 1.7% | -2.7% |
| 🇮🇳 India* | 6.5% | 2.0% |
| 🇮🇩 Indonesia | 5.0% | 3.0% |
| 🇮🇷 Iran | 2.5% | 3.1% |
| 🇮🇶 Iraq | 2.9% | 0.7% |
| 🇮🇪 Ireland | 3.3% | 2.0% |
| 🇮🇱 Israel | 3.0% | 2.0% |
| 🇮🇹 Italy* | 0.7% | 2.6% |
| 🇯🇲 Jamaica | 1.8% | 4.6% |
| 🇯🇵 Japan* | 0.9% | 5.0% |
| 🇯🇴 Jordan | 2.7% | 2.6% |
| 🇰🇿 Kazakhstan | 4.2% | 1.4% |
| 🇰🇪 Kenya | 5.3% | 3.8% |
| 🇰🇮 Kiribati | 2.4% | -0.6% |
| 🇰🇷 Korea | 2.2% | 3.4% |
| 🇽🇰 Kosovo | 4.0% | 4.0% |
| 🇰🇼 Kuwait | 3.6% | 0.5% |
| 🇰🇬 Kyrgyz Republic | 4.3% | 2.1% |
| 🇱🇦 Lao P.D.R. | 4.0% | 4.6% |
| 🇱🇻 Latvia | 2.6% | 12.5% |
| 🇱🇸 Lesotho | 2.3% | -0.2% |
| 🇱🇷 Liberia | 5.3% | -0.4% |
| 🇱🇾 Libya | 7.5% | 74.4% |
| 🇱🇹 Lithuania | 2.7% | 4.0% |
| 🇱🇺 Luxembourg | 1.5% | 1.7% |
| 🇲🇴 Macao SAR | 27.2% | 4.0% |
| 🇲🇬 Madagascar | 4.8% | 8.1% |
| 🇲🇼 Malawi | 3.3% | 4.5% |
| 🇲🇾 Malaysia | 4.3% | 3.8% |
| 🇲🇻 Maldives | 5.0% | 3.0% |
| 🇲🇱 Mali | 4.8% | 4.5% |
| 🇲🇹 Malta | 3.3% | 5.1% |
| 🇲🇭 Marshall Islands | 3.0% | 3.2% |
| 🇲🇷 Mauritania | 5.3% | 2.6% |
| 🇲🇺 Mauritius | 3.8% | 2.0% |
| 🇲🇽 Mexico* | 2.7% | 5.5% |
| 🇫🇲 Micronesia | 3.1% | 4.5% |
| 🇲🇩 Moldova | 4.3% | 2.4% |
| 🇲🇳 Mongolia | 4.5% | 7.0% |
| 🇲🇪 Montenegro | 3.7% | 2.6% |
| 🇲🇦 Morocco | 3.6% | 2.8% |
| 🇲🇿 Mozambique | 5.0% | 0.5% |
| 🇲🇲 Myanmar | 2.6% | 0.8% |
| 🇳🇦 Namibia | 2.7% | 0.6% |
| 🇳🇷 Nauru | 1.3% | 1.1% |
| 🇳🇵 Nepal | 5.0% | 3.0% |
| 🇳🇱 Netherlands | 1.2% | 4.1% |
| 🇳🇿 New Zealand | 1.0% | 2.9% |
| 🇳🇮 Nicaragua | 3.3% | 2.5% |
| 🇳🇪 Niger | 11.1% | 2.3% |
| 🇳🇬 Nigeria* | 3.0% | 1.2% |
| 🇲🇰 North Macedonia | 3.2% | -0.5% |
| 🇳🇴 Norway | 1.5% | 0.8% |
| 🇴🇲 Oman | 2.7% | 6.0% |
| 🇵🇰 Pakistan | 2.5% | 3.0% |
| 🇵🇼 Palau | 12.4% | 4.5% |
| 🇵🇦 Panama | 4.0% | 1.1% |
| 🇵🇬 Papua New Guinea | 5.0% | 5.3% |
| 🇵🇾 Paraguay | 3.8% | 0.6% |
| 🇵🇪 Peru | 2.7% | 2.3% |
| 🇵🇭 Philippines | 5.9% | -0.7% |
| 🇵🇱 Poland | 2.3% | 2.4% |
| 🇵🇹 Portugal | 1.5% | 4.0% |
| 🇵🇷 Puerto Rico | -0.2% | 2.2% |
| 🇶🇦 Qatar | 2.2% | 2.2% |
| 🇷🇴 Romania | 3.8% | 6.2% |
| 🇷🇺 Russia* | 2.6% | 0.5% |
| 🇷🇼 Rwanda | 7.0% | 8.0% |
| 🇼🇸 Samoa | 3.6% | 2.2% |
| 🇸🇲 San Marino | 1.3% | 0.8% |
| 🇸🇹 São Tomé and Príncipe | 2.4% | 4.1% |
| 🇸🇦 Saudi Arabia* | 2.7% | 2.0% |
| 🇸🇳 Senegal | 8.8% | 4.2% |
| 🇷🇸 Serbia | 3.0% | 2.7% |
| 🇸🇨 Seychelles | 3.9% | 1.0% |
| 🇸🇱 Sierra Leone | 4.7% | 1.3% |
| 🇸🇬 Singapore | 2.1% | 2.0% |
| 🇸🇰 Slovak Republic | 2.5% | 2.5% |
| 🇸🇮 Slovenia | 2.2% | 2.8% |
| 🇸🇧 Solomon Islands | 2.4% | 0.9% |
| 🇸🇴 Somalia | 3.7% | 3.5% |
| 🇿🇦 South Africa* | 1.0% | 2.5% |
| 🇸🇸 South Sudan | 4.2% | 4.9% |
| 🇪🇸 Spain* | 1.5% | 3.2% |
| 🇰🇳 St. Kitts and Nevis | 3.8% | 6.2% |
| 🇱🇨 St. Lucia | 2.3% | -18.3% |
| 🇻🇨 St. Vincent and the Grenadines | 5.0% | 2.1% |
| 🇸🇩 Sudan | 0.3% | -0.7% |
| 🇸🇷 Suriname | 3.0% | 0.9% |
| 🇸🇪 Sweden | 0.6% | 4.0% |
| 🇨🇭 Switzerland | 1.8% | 0.8% |
| 🇹🇼 Taiwan | 3.0% | 6.5% |
| 🇹🇯 Tajikistan | 5.0% | 5.2% |
| 🇹🇿 Tanzania | 6.1% | 2.7% |
| 🇹🇭 Thailand | 3.2% | 4.3% |
| 🇹🇱 Timor-Leste | 3.1% | 5.6% |
| 🇹🇬 Togo | 5.3% | 1.5% |
| 🇹🇴 Tonga | 2.5% | 5.4% |
| 🇹🇹 Trinidad and Tobago | 2.2% | 2.6% |
| 🇹🇳 Tunisia | 1.9% | 2.5% |
| 🇹🇷 Türkiye | 3.0% | 1.3% |
| 🇹🇲 Turkmenistan | 2.1% | 2.5% |
| 🇹🇻 Tuvalu | 3.5% | 3.9% |
| 🇺🇬 Uganda | 5.7% | 4.6% |
| 🇺🇦 Ukraine | 3.2% | 2.0% |
| 🇦🇪 United Arab Emirates | 4.0% | 3.4% |
| 🇬🇧 United Kingdom* | 0.6% | 0.5% |
| 🇺🇸 U.S.* | 2.1% | 2.1% |
| 🇺🇾 Uruguay | 3.3% | 1.0% |
| 🇺🇿 Uzbekistan | 5.5% | 5.5% |
| 🇻🇺 Vanuatu | 2.6% | 1.5% |
| 🇻🇪 Venezuela | 4.5% | 4.0% |
| 🇻🇳 Vietnam | 5.8% | 4.7% |
| 🇵🇸 West Bank and Gaza | 2.7% | 3.0% |
| 🇾🇪 Yemen | 2.0% | -0.5% |
| 🇿🇲 Zambia | 4.3% | 3.6% |
| 🇿🇼 Zimbabwe | 3.6% | 4.1% |
*Reflect updated figures from the January 2024 IMF Update
In the United States, GDP growth is projected to remain moderately strong, supported by rising real wages boosting consumption across the economy.
Yet compared to last year, growth is set to slow amid a softening labor market. In 2024, Citigroup announced it was laying off 20,000 employees after a disappointing year. Meanwhile, tech firms such as Google, Amazon, and Salesforce are reducing headcounts. Along with this, package delivery giant UPS announced 12,000 job cuts.
In China, property market woes are dragging on economic growth. Declining real estate values have impacted incomes, assets, and the public mood. Due to these headwinds, consumption growth is forecast to drop over the year.
Over in Latin America, Chile and Brazil were among the first emerging countries to hike interest rates in 2021—and they were some of the first to cut them last year. Thanks to improving domestic demand amid dissipating price spikes, the IMF upgraded the outlooks for Brazil and Mexico in 2024.
The lowest growth across all regions is forecast to be seen in Europe, at 0.9%. In late 2023, Signa, a multi-billion European property firm collapsed following the sharpest rise in interest rates in the European Union’s 25-year history. Also dimming the outlook is low consumer sentiment and the impact of high energy prices.
What are the Key Risks?
While no one holds a crystal ball, there are certain risks outlined by the IMF that could negatively impact global GDP growth:
- Sharply Rising Commodity Prices: If geopolitical tensions escalate in the Israel-Hamas war, it could spillover into the broader region leading to spikes in energy prices. Over a third of global oil exports are based out of the region, in addition to 14% of global gas exports. Adding to this, 11% of international trade passes through the Red Sea, which has seen continued attacks between Iran-backed Houthi rebels and strikes from the U.S. and its allies.
- Stubborn Inflation: A return of supply disruptions paired with an overheated labor market could add inflationary pressures, potentially leading to higher interest rates. In turn, stock markets could respond adversely and financial stability could deteriorate.
- China’s Economy Slows: A property market rout could hurt domestic growth and consumer confidence, leading to declining consumption across the country. Accounting for nearly 19% of global GDP (PPP) in 2023, a slowing Chinese economy could impact countries that rely on trade with China.
While these risks remain present, the economy could witness positive surprises as well. Should inflation fall faster than expected, it would likely lead to monetary easing and a boost to global economic growth. Overall, the global economy defied expectations in 2023, and it may do the same in 2024.


Markets
The European Stock Market: Attractive Valuations Offer Opportunities
On average, the European stock market has valuations that are nearly 50% lower than U.S. valuations. But how can you access the market?


European Stock Market: Attractive Valuations Offer Opportunities
Europe is known for some established brands, from L’Oréal to Louis Vuitton. However, the European stock market offers additional opportunities that may be lesser known.
The above infographic, sponsored by STOXX, outlines why investors may want to consider European stocks.
Attractive Valuations
Compared to most North American and Asian markets, European stocks offer lower or comparable valuations.
| Index | Price-to-Earnings Ratio | Price-to-Book Ratio |
|---|---|---|
| EURO STOXX 50 | 14.9 | 2.2 |
| STOXX Europe 600 | 14.4 | 2 |
| U.S. | 25.9 | 4.7 |
| Canada | 16.1 | 1.8 |
| Japan | 15.4 | 1.6 |
| Asia Pacific ex. China | 17.1 | 1.8 |
Data as of February 29, 2024. See graphic for full index names. Ratios based on trailing 12 month financials. The price to earnings ratio excludes companies with negative earnings.
On average, European valuations are nearly 50% lower than U.S. valuations, potentially offering an affordable entry point for investors.
Research also shows that lower price ratios have historically led to higher long-term returns.
Market Movements Not Closely Connected
Over the last decade, the European stock market had low-to-moderate correlation with North American and Asian equities.
The below chart shows correlations from February 2014 to February 2024. A value closer to zero indicates low correlation, while a value of one would indicate that two regions are moving in perfect unison.
| EURO STOXX 50 | STOXX EUROPE 600 | U.S. | Canada | Japan | Asia Pacific ex. China |
|
|---|---|---|---|---|---|---|
| EURO STOXX 50 | 1.00 | 0.97 | 0.55 | 0.67 | 0.24 | 0.43 |
| STOXX EUROPE 600 | 1.00 | 0.56 | 0.71 | 0.28 | 0.48 | |
| U.S. | 1.00 | 0.73 | 0.12 | 0.25 | ||
| Canada | 1.00 | 0.22 | 0.40 | |||
| Japan | 1.00 | 0.88 | ||||
| Asia Pacific ex. China | 1.00 |
Data is based on daily USD returns.
European equities had relatively independent market movements from North American and Asian markets. One contributing factor could be the differing sector weights in each market. For instance, technology makes up a quarter of the U.S. market, but health care and industrials dominate the broader European market.
Ultimately, European equities can enhance portfolio diversification and have the potential to mitigate risk for investors.
Tracking the Market
For investors interested in European equities, STOXX offers a variety of flagship indices:
| Index | Description | Market Cap |
|---|---|---|
| STOXX Europe 600 | Pan-regional, broad market | €10.5T |
| STOXX Developed Europe | Pan-regional, broad-market | €9.9T |
| STOXX Europe 600 ESG-X | Pan-regional, broad market, sustainability focus | €9.7T |
| STOXX Europe 50 | Pan-regional, blue-chip | €5.1T |
| EURO STOXX 50 | Eurozone, blue-chip | €3.5T |
Data is as of February 29, 2024. Market cap is free float, which represents the shares that are readily available for public trading on stock exchanges.
The EURO STOXX 50 tracks the Eurozone’s biggest and most traded companies. It also underlies one of the world’s largest ranges of ETFs and mutual funds. As of November 2023, there were €27.3 billion in ETFs and €23.5B in mutual fund assets under management tracking the index.
“For the past 25 years, the EURO STOXX 50 has served as an accurate, reliable and tradable representation of the Eurozone equity market.”
— Axel Lomholt, General Manager at STOXX
Partnering with STOXX to Track the European Stock Market
Are you interested in European equities? STOXX can be a valuable partner:
- Comprehensive, liquid and investable ecosystem
- European heritage, global reach
- Highly sophisticated customization capabilities
- Open architecture approach to using data
- Close partnerships with clients
- Part of ISS STOXX and Deutsche Börse Group
With a full suite of indices, STOXX can help you benchmark against the European stock market.
Learn how STOXX’s European indices offer liquid and effective market access.

-

 Economy2 days ago
Economic Growth Forecasts for G7 and BRICS Countries in 2024
The IMF has released its economic growth forecasts for 2024. How do the G7 and BRICS countries compare?
-

 Markets1 week ago
U.S. Debt Interest Payments Reach $1 Trillion
U.S. debt interest payments have surged past the $1 trillion dollar mark, amid high interest rates and an ever-expanding debt burden.
-

 United States2 weeks ago
Ranked: The Largest U.S. Corporations by Number of Employees
We visualized the top U.S. companies by employees, revealing the massive scale of retailers like Walmart, Target, and Home Depot.
-

 Markets2 weeks ago
The Top 10 States by Real GDP Growth in 2023
This graphic shows the states with the highest real GDP growth rate in 2023, largely propelled by the oil and gas boom.
-

 Markets2 weeks ago
Ranked: The World’s Top Flight Routes, by Revenue
In this graphic, we show the highest earning flight routes globally as air travel continued to rebound in 2023.
-

 Markets3 weeks ago
Ranked: The Most Valuable Housing Markets in America
The U.S. residential real estate market is worth a staggering $47.5 trillion. Here are the most valuable housing markets in the country.


-

 Debt1 week ago
How Debt-to-GDP Ratios Have Changed Since 2000
-
Markets2 weeks ago
Ranked: The World’s Top Flight Routes, by Revenue
-

 Demographics2 weeks ago
Population Projections: The World’s 6 Largest Countries in 2075
-
Markets2 weeks ago
The Top 10 States by Real GDP Growth in 2023
-

 Demographics2 weeks ago
The Smallest Gender Wage Gaps in OECD Countries
-

 United States2 weeks ago
Where U.S. Inflation Hit the Hardest in March 2024
-

 Green2 weeks ago
Top Countries By Forest Growth Since 2001
-
United States2 weeks ago
Ranked: The Largest U.S. Corporations by Number of Employees