Economy
Visualizing All of China’s Trade Partners
Article/Editing:
Click to view this graphic in a higher-resolution.
Visualizing All of China’s Trade Partners
China stands as a formidable player in the global trade arena, wielding its influence as the world’s largest goods exporter.
With a complex network of trade partnerships spanning more than 200 countries, regions, and territories, the world’s second-largest economy has significant economic relationships with both allies and adversaries.
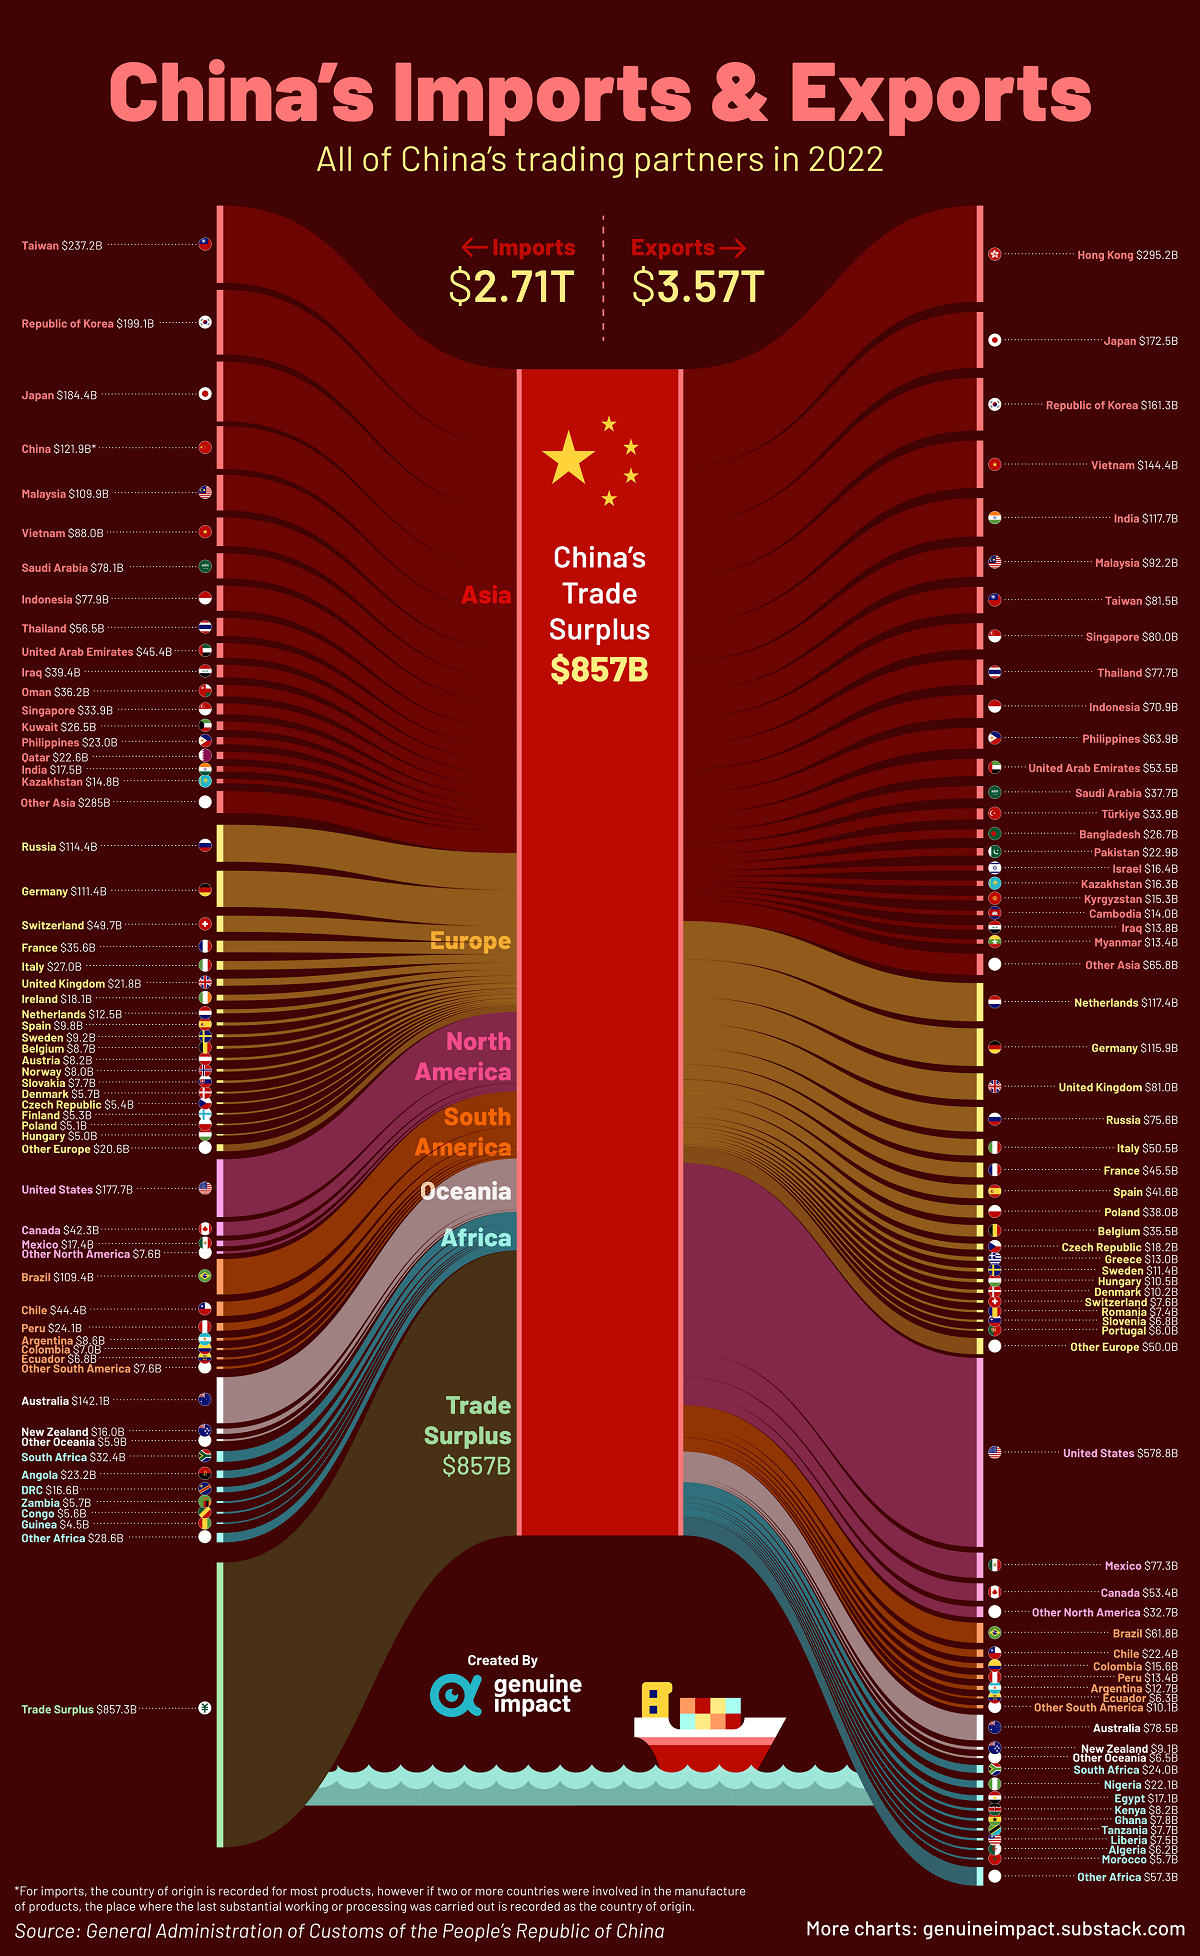
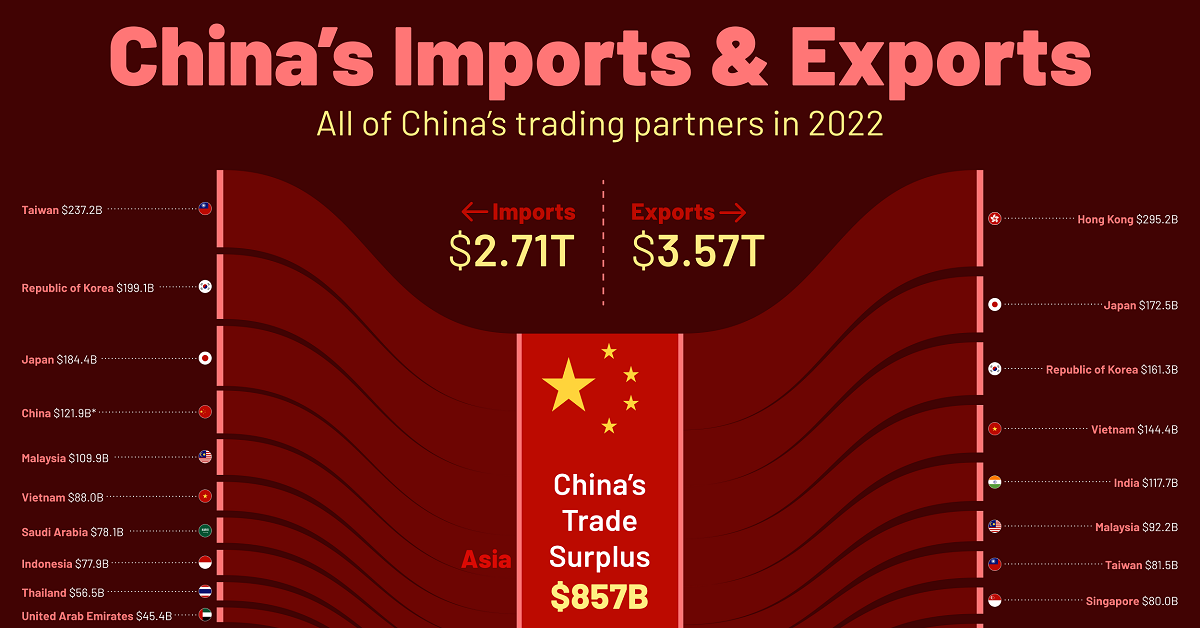
By using 2022 trade data from China’s General Administration of Customs, this visualization from Truman Du breaks down the nation’s top trading partners through imports and exports by destination.
China’s Imports and Exports by Country in 2022
Over the course of 2022, China saw exports totaling $3.57 trillion and imports totaling $2.71 trillion, giving it a massive trade surplus of $857 billion.
| Country | Imports (2022 USD) | Exports (2022 USD) | Balance (2022 USD) |
|---|---|---|---|
| 🇺🇸 United States | $177.7B | $578.8B | +$401.1B |
| 🇭🇰 Hong Kong | $7.8B | $295.2B | +$287.4B |
| 🇳🇱 Netherlands | $12.5B | $117.4B | +$104.9B |
| 🇮🇳 India | $17.5B | $117.7B | +$100.3B |
| 🇲🇽 Mexico | $17.4B | $77.3B | +$59.8B |
| 🇬🇧 United Kingdom | $21.8B | $81.0B | +$59.2B |
| 🇻🇳 Vietnam | $88.0B | $144.4B | +$56.4B |
| 🇸🇬 Singapore | $33.9B | $80.0B | +$46.1B |
| 🇵🇭 Philippines | $23.0B | $63.9B | +$40.9B |
| 🇵🇱 Poland | $5.1B | $38.0B | +$32.9B |
| 🇪🇸 Spain | $9.8B | $41.6B | +$31.9B |
| 🇹🇷 Türkiye | $4.5B | $33.9B | +$29.4B |
| 🇧🇪 Belgium | $8.7B | $35.5B | +$26.7B |
| 🇧🇩 Bangladesh | $1.0B | $26.7B | +$25.7B |
| 🇮🇹 Italy | $27.0B | $50.5B | +$23.6B |
| 🇹🇭 Thailand | $56.5B | $77.7B | +$21.1B |
| 🇳🇬 Nigeria | $1.6B | $22.1B | +$20.5B |
| 🇵🇰 Pakistan | $3.4B | $22.9B | +$19.5B |
| 🇪🇬 Egypt | $1.0B | $17.1B | +$16.0B |
| 🇰🇬 Kyrgyzstan | $0.1B | $15.3B | +$15.3B |
| 🇨🇿 Czechia | $5.4B | $18.2B | +$12.8B |
| 🇰🇭 Cambodia | $1.8B | $14.0B | +$12.2B |
| 🇬🇷 Greece | $0.8B | $12.9B | +$12.1B |
| 🇵🇦 Panama | $1.2B | $12.6B | +$11.4B |
| 🇨🇦 Canada | $42.3B | $53.4B | +$11.1B |
| 🇫🇷 France | $35.6B | $45.5B | +$9.9B |
| 🇨🇴 Colombia | $7.0B | $15.5B | +$8.5B |
| 🇦🇪 United Arab Emirates | $45.4B | $53.5B | +$8.1B |
| 🇰🇪 Kenya | $0.3B | $8.2B | +$7.9B |
| 🇱🇷 Liberia | $0.0B | $7.5B | +$7.5B |
| 🇮🇱 Israel | $9.0B | $16.4B | +$7.4B |
| 🇹🇿 Tanzania | $0.5B | $7.7B | +$7.1B |
| 🇸🇮 Slovenia | $0.6B | $6.8B | +$6.3B |
| 🇬🇭 Ghana | $2.3B | $7.8B | +$5.5B |
| 🇭🇺 Hungary | $5.0B | $10.5B | +$5.4B |
| 🇺🇿 Uzbekistan | $2.3B | $7.4B | +$5.1B |
| 🇩🇿 Algeria | $1.1B | $6.2B | +$5.1B |
| 🇯🇴 Jordan | $0.7B | $5.7B | +$4.9B |
| 🇲🇦 Morocco | $0.9B | $5.7B | +$4.8B |
| 🇩🇪 Germany | $111.4B | $115.9B | +$4.5B |
| 🇩🇰 Denmark | $5.7B | $10.2B | +$4.4B |
| 🇷🇴 Romania | $3.1B | $7.4B | +$4.3B |
| 🇦🇷 Argentina | $8.6B | $12.7B | +$4.1B |
| 🇲🇴 Macao | $0.1B | $4.2B | +$4.1B |
| 🇬🇹 Guatemala | $0.6B | $4.3B | +$3.8B |
| 🇩🇴 Dominican Republic | $0.5B | $4.3B | +$3.7B |
| 🇸🇳 Senegal | $0.3B | $4.0B | +$3.7B |
| 🇲🇭 Marshall Islands | $0.0B | $3.5B | +$3.5B |
| 🇱🇰 Sri Lanka | $0.5B | $3.7B | +$3.2B |
| 🇩🇯 Djibouti | $0.1B | $3.2B | +$3.1B |
| 🇮🇷 Iran | $6.4B | $9.4B | +$3.0B |
| 🇹🇬 Togo | $0.2B | $3.1B | +$2.9B |
| 🇵🇹 Portugal | $3.0B | $6.0B | +$2.9B |
| 🇨🇮 Cote d'Ivoire | $1.0B | $3.5B | +$2.5B |
| 🇨🇲 Cameroon | $0.7B | $3.1B | +$2.5B |
| 🇱🇧 Lebanon | $0.1B | $2.5B | +$2.4B |
| 🇸🇪 Sweden | $9.1B | $11.4B | +$2.2B |
| 🇻🇪 Venezuela | $0.8B | $3.0B | +$2.1B |
| 🇾🇪 Yemen | $0.6B | $2.8B | +$2.1B |
| 🇭🇷 Croatia | $0.2B | $2.3B | +$2.1B |
| 🇲🇿 Mozambique | $1.3B | $3.2B | +$1.9B |
| 🇲🇲 Myanmar | $11.5B | $13.4B | +$1.9B |
| 🇹🇯 Tajikistan | $0.4B | $2.2B | +$1.8B |
| 🇵🇾 Paraguay | $0.1B | $1.9B | +$1.8B |
| 🇪🇹 Ethiopia | $0.5B | $2.2B | +$1.8B |
| 🇱🇹 Lithuania | $0.1B | $1.8B | +$1.7B |
| 🇳🇵 Nepal | $0.0B | $1.6B | +$1.6B |
| 🇹🇳 Tunisia | $0.3B | $1.9B | +$1.6B |
| 🇧🇬 Bulgaria | $1.3B | $2.8B | +$1.6B |
| 🇭🇳 Honduras | $0.0B | $1.6B | +$1.5B |
| 🇧🇭 Bahrain | $0.3B | $1.8B | +$1.5B |
| 🇰🇿 Kazakhstan | $14.8B | $16.3B | +$1.5B |
| 🇧🇾 Belarus | $1.8B | $3.2B | +$1.4B |
| 🇧🇯 Benin | $0.3B | $1.7B | +$1.4B |
| 🇸🇻 El Salvador | $0.2B | $1.7B | +$1.4B |
| 🇲🇹 Malta | $0.6B | $2.0B | +$1.4B |
| 🇸🇩 Sudan | $0.9B | $2.0B | +$1.1B |
| 🇨🇾 Cyprus | $0.0B | $1.2B | +$1.1B |
| 🇬🇪 Georgia | $0.1B | $1.2B | +$1.1B |
| 🇸🇴 Somalia | $0.0B | $1.0B | +$1.0B |
| 🇦🇿 Azerbaijan | $0.1B | $1.1B | +$1.0B |
| 🇯🇲 Jamaica | $0.0B | $1.0B | +$1.0B |
| 🇺🇬 Uganda | $0.1B | $1.1B | +$1.0B |
| 🇲🇺 Mauritius | $0.0B | $1.0B | +$0.9B |
| 🇷🇸 Serbia | $1.4B | $2.2B | +$0.8B |
| 🇲🇬 Madagascar | $0.6B | $1.4B | +$0.8B |
| 🇰🇵 Korea, DPR | $0.1B | $0.8B | +$0.7B |
| 🇳🇮 Nicaragua | $0.0B | $0.7B | +$0.7B |
| 🇪🇪 Estonia | $0.3B | $0.9B | +$0.7B |
| 🇱🇻 Latvia | $0.4B | $1.0B | +$0.6B |
| 🇭🇹 Haiti | $0.0B | $0.6B | +$0.6B |
| 🇦🇱 Albania | $0.2B | $0.7B | +$0.5B |
| 🇦🇫 Afghanistan | $0.0B | $0.6B | +$0.5B |
| 🇲🇱 Mali | $0.1B | $0.6B | +$0.5B |
| 🇫🇯 Fiji | $0.0B | $0.5B | +$0.5B |
| 🇲🇻 Maldives | $0.0B | $0.4B | +$0.4B |
| 🇸🇾 Syria | $0.0B | $0.4B | +$0.4B |
| 🇬🇲 Gambia | $0.0B | $0.4B | +$0.4B |
| 🇧🇫 Burkina Faso | $0.1B | $0.5B | +$0.4B |
| 🇧🇸 Bahamas | $0.0B | $0.4B | +$0.4B |
| 🇳🇪 Niger | $0.3B | $0.7B | +$0.4B |
| 🇨🇷 Costa Rica | $2.0B | $2.4B | +$0.4B |
| 🇷🇼 Rwanda | $0.1B | $0.4B | +$0.3B |
| 🇧🇿 Belize | $0.0B | $0.3B | +$0.3B |
| 🇸🇷 Suriname | $0.0B | $0.3B | +$0.3B |
| 🇲🇼 Malawi | $0.0B | $0.3B | +$0.3B |
| 🇷🇪 Réunion | $0.0B | $0.2B | +$0.2B |
| 🇱🇺 Luxembourg | $0.3B | $0.5B | +$0.2B |
| 🇧🇴 Bolivia | $0.9B | $1.1B | +$0.2B |
| 🇲🇪 Montenegro | $0.0B | $0.2B | +$0.2B |
| 🇧🇹 Bhutan | $0.0B | $0.2B | +$0.2B |
| 🇵🇸 Palestine | $0.0B | $0.2B | +$0.2B |
| 🇵🇫 French Polynesia | $0.0B | $0.2B | +$0.1B |
| 🇹🇱 Timor-Leste | $0.1B | $0.3B | +$0.1B |
| 🇧🇧 Barbados | $0.0B | $0.2B | +$0.1B |
| 🇲🇩 Moldova | $0.1B | $0.2B | +$0.1B |
| 🇼🇸 Samoa | $0.0B | $0.1B | +$0.1B |
| 🇮🇸 Iceland | $0.2B | $0.3B | +$0.1B |
| 🇻🇬 British Virgin Islands | $0.0B | $0.1B | +$0.1B |
| 🇧🇮 Burundi | $0.0B | $0.1B | +$0.1B |
| 🌏 Other Oceanian Territories | $0.0B | $0.1B | +$0.1B |
| 🇦🇬 Antigua and Barbuda | $0.0B | $0.1B | +$0.1B |
| 🇸🇨 Seychelles | $0.0B | $0.1B | +$0.1B |
| 🇨🇻 Cabo Verde | $0.0B | $0.1B | +$0.1B |
| 🇻🇺 Vanuatu | $0.0B | $0.1B | +$0.1B |
| 🇧🇲 Bermuda | $0.0B | $0.1B | +$0.1B |
| 🇸🇿 Eswatini | $0.0B | $0.1B | +$0.1B |
| 🇬🇵 Guadeloupe | $0.0B | $0.1B | +$0.1B |
| 🇰🇲 Comoros | $0.0B | $0.1B | +$0.1B |
| 🇦🇼 Aruba | $0.0B | $0.1B | +$0.1B |
| 🇧🇦 Bosnia and Herzegovina | $0.1B | $0.2B | +$0.1B |
| 🇨🇼 Curaçao | $0.0B | $0.1B | +$0.1B |
| 🇾🇹 Mayotte | $0.0B | $0.1B | +$0.1B |
| 🇬🇼 Guinea-Bissau | $0.0B | $0.1B | +$0.1B |
| 🇹🇴 Tonga | $0.0B | $0.1B | +$0.1B |
| 🇲🇰 North Macedonia | $0.2B | $0.2B | +$0.1B |
| 🇰🇾 Cayman Islands | $0.0B | $0.1B | +$0.1B |
| 🌎 Other Latin American Territories | $0.0B | $0.1B | +$0.1B |
| 🇵🇼 Palau | $0.0B | $0.1B | +$0.1B |
| 🇲🇶 Martinique | $0.0B | $0.0B | +$0.0B |
| 🇰🇮 Kiribati | $0.0B | $0.0B | +$0.0B |
| 🇬🇫 French Guiana | $0.0B | $0.0B | +$0.0B |
| 🇱🇸 Lesotho | $0.0B | $0.1B | +$0.0B |
| 🇱🇨 Saint Lucia | $0.0B | $0.0B | +$0.0B |
| 🇩🇲 Dominica | $0.0B | $0.0B | +$0.0B |
| 🇹🇻 Tuvalu | $0.0B | $0.0B | +$0.0B |
| 🇫🇲 Federated States of Micronesia | $0.0B | $0.0B | +$0.0B |
| 🇨🇫 Central African Republic | $0.0B | $0.1B | +$0.0B |
| 🇧🇶 Bonaire, Sint Eustatius, and Saba | $0.0B | $0.0B | +$0.0B |
| 🇬🇩 Grenada | $0.0B | $0.0B | +$0.0B |
| 🇦🇩 Andorra | $0.0B | $0.0B | +$0.0B |
| 🇻🇨 Saint Vincent and the Grenadines | $0.0B | $0.0B | +$0.0B |
| 🇬🇮 Gibraltar | $0.0B | $0.0B | +$0.0B |
| 🇸🇹 Sao Tome and Principe | $0.0B | $0.0B | +$0.0B |
| 🌍 Other European Territories | $0.0B | $0.0B | +$0.0B |
| 🇰🇳 Saint Kitts and Nevis | $0.0B | $0.0B | +$0.0B |
| 🇳🇷 Nauru | $0.0B | $0.0B | +$0.0B |
| 🇨🇰 Cook Islands | $0.0B | $0.0B | +$0.0B |
| 🇹🇨 Turks and Caicos Islands | $0.0B | $0.0B | +$0.0B |
| 🇲🇫 Saint Martin | $0.0B | $0.0B | +$0.0B |
| 🌏 Other North American Territories | $0.0B | $0.0B | +$0.0B |
| 🇸🇲 San Marino | $0.0B | $0.0B | +$0.0B |
| 🌍 Other African Territories | $0.0B | $0.0B | +$0.0B |
| 🇮🇨 Canary Islands | $0.0B | $0.0B | +$0.0B |
| 🇼🇫 Wallis and Futuna | $0.0B | $0.0B | +$0.0B |
| 🇳🇫 Norfolk Island | $0.0B | $0.0B | +$0.0B |
| 🇪🇭 Western Sahara | $0.0B | $0.0B | +$0.0B |
| 🌏 Other Asian Territories | $0.0B | $0.0B | +$0.0B |
| 🇲🇸 Montserrat | $0.0B | $0.0B | +$0.0B |
| 🇪🇺 Ceuta | $0.0B | $0.0B | +$0.0B |
| 🇻🇦 Holy See | $0.0B | $0.0B | +$0.0B |
| 🇪🇺 Melilla | $0.0B | $0.0B | +$0.0B |
| 🇵🇲 Saint Pierre and Miquelon | $0.0B | $0.0B | +$0.0B |
| 🇧🇶 Bonaire | $0.0B | $0.0B | +$0.0B |
| 🇲🇨 Monaco | $0.0B | $0.0B | -$0.0B |
| 🇨🇺 Cuba | $0.5B | $0.4B | -$0.0B |
| 🇳🇦 Namibia | $0.6B | $0.6B | -$0.0B |
| 🇸🇸 South Sudan | $0.2B | $0.2B | -$-0.1B |
| 🇸🇧 Solomon Islands | $0.3B | $0.2B | -$-0.1B |
| 🇫🇴 Faroe Islands | $0.1B | $0.0B | -$-0.1B |
| 🇱🇮 Liechtenstein | $0.2B | $0.1B | -$-0.1B |
| 🇧🇼 Botswana | $0.4B | $0.2B | -$-0.2B |
| 🇿🇼 Zimbabwe | $1.3B | $1.1B | -$-0.2B |
| 🇸🇱 Sierra Leone | $0.8B | $0.6B | -$-0.2B |
| 🇹🇹 Trinidad and Tobago | $0.8B | $0.5B | -$-0.2B |
| 🇲🇷 Mauritania | $1.2B | $0.9B | -$-0.2B |
| 🇦🇲 Armenia | $0.8B | $0.5B | -$-0.3B |
| 🇪🇷 Eritrea | $0.5B | $0.1B | -$-0.3B |
| 🇵🇷 Puerto Rico | $1.3B | $1.0B | -$-0.3B |
| 🇬🇱 Greenland | $0.4B | $0.0B | -$-0.4B |
| 🇪🇨 Ecuador | $6.8B | $6.3B | -$-0.6B |
| 🇱🇾 Libya | $2.9B | $2.4B | -$-0.6B |
| 🇫🇮 Finland | $5.3B | $4.5B | -$-0.7B |
| 🇬🇾 Guyana | $1.3B | $0.6B | -$-0.7B |
| 🇹🇩 Chad | $1.1B | $0.3B | -$-0.8B |
| 🇺🇦 Ukraine | $4.3B | $3.3B | -$-1.1B |
| 🇱🇦 Laos | $3.4B | $2.3B | -$-1.1B |
| 🇬🇶 Equatorial Guinea | $1.5B | $0.2B | -$-1.3B |
| 🌏 Unknown Countries (Territories) | $1.4B | $0.0B | -$-1.4B |
| 🇧🇳 Brunei | $2.2B | $0.8B | -$-1.4B |
| 🇺🇾 Uruguay | $4.5B | $3.0B | -$-1.5B |
| 🇳🇨 New Caledonia | $1.9B | $0.2B | -$-1.7B |
| 🇬🇳 Guinea | $4.5B | $2.3B | -$-2.3B |
| 🇵🇬 Papua New Guinea | $3.8B | $1.4B | -$-2.4B |
| 🇳🇴 Norway | $8.0B | $5.2B | -$-2.8B |
| 🇦🇹 Austria | $8.2B | $5.1B | -$-3.1B |
| 🇸🇰 Slovakia | $7.7B | $4.4B | -$-3.3B |
| 🇬🇦 Gabon | $3.9B | $0.6B | -$-3.4B |
| 🇨🇬 Congo | $5.6B | $1.0B | -$-4.6B |
| 🇿🇲 Zambia | $5.7B | $1.0B | -$-4.8B |
| 🇲🇳 Mongolia | $9.3B | $2.9B | -$-6.5B |
| 🇳🇿 New Zealand | $16.0B | $9.1B | -$-6.8B |
| 🇮🇩 Indonesia | $77.9B | $70.9B | -$-7.0B |
| 🇿🇦 South Africa | $32.4B | $24.0B | -$-8.4B |
| 🇹🇲 Turkmenistan | $10.3B | $0.9B | -$-9.5B |
| 🇵🇪 Peru | $24.1B | $13.4B | -$-10.7B |
| 🇨🇩 Democratic Republic of Congo | $16.6B | $5.1B | -$-11.5B |
| 🇯🇵 Japan | $184.4B | $172.5B | -$-11.9B |
| 🇮🇪 Ireland | $18.1B | $5.7B | -$-12.4B |
| 🇲🇾 Malaysia | $109.9B | $92.2B | -$-17.7B |
| 🇶🇦 Qatar | $22.6B | $3.9B | -$-18.6B |
| 🇦🇴 Angola | $23.2B | $4.0B | -$-19.2B |
| 🇰🇼 Kuwait | $26.5B | $4.9B | -$-21.6B |
| 🇨🇱 Chile | $44.4B | $22.4B | -$-22.0B |
| 🇮🇶 Iraq | $39.4B | $13.8B | -$-25.6B |
| 🇴🇲 Oman | $36.2B | $4.2B | -$-32.1B |
| 🇰🇷 Republic of Korea | $199.1B | $161.3B | -$-37.8B |
| 🇷🇺 Russia | $114.4B | $75.6B | -$-38.7B |
| 🇸🇦 Saudi Arabia | $78.1B | $37.7B | -$-40.4B |
| 🇨🇭 Switzerland | $49.7B | $7.6B | -$-42.1B |
| 🇧🇷 Brazil | $109.4B | $61.8B | -$-47.6B |
| 🇦🇺 Australia | $142.1B | $78.5B | -$-63.6B |
| 🇨🇳 China | $121.9B | N/A | -$-121.9B |
| 🇹🇼 Taiwan | $237.2B | $81.5B | -$-155.8B |
China had individual trade surpluses with the overwhelming majority of its trade partners: 174 of the 234 countries and territories listed.
These trade surpluses are especially visible in China’s trade relationships with many of the world’s largest economies, including the U.S. and India, with $401.1 billion and $100.3 billion surpluses respectively.
Meanwhile, a good sum of the country’s trade deficits are with major Asian economies. Its largest deficit is with Taiwan, primarily coming from integrated circuit imports. China also has deficits with Japan (-$11.9 billion) and South Korea (-$37.8 billion), the region’s second and fourth-largest economies respectively, largely due to electronics and machinery imports.
The country’s other trade deficits stem from fulfilling strategic needs. For example, China has deficits with oil-producing countries like Russia and Saudi Arabia. It also has a trade deficit with Australia, a key supplier of raw goods such as iron, gold, lithium, and liquefied petroleum gas.
China’s Evolving Trade Partner Relationships
China’s trade relationships extend far beyond just economic considerations; they reflect historical, geopolitical, and strategic factors as well.
Taiwan’s major role in the semiconductor market, for example, makes it both a valuable trade partner and a contentious rival. China considers Taiwan a part of its territory, while Taiwan operates as a separate, self-governed entity.
Likewise, China’s increasing investments in infrastructure across parts of Asia and Africa are starting to reflect growing trade balances with developing countries set to become major trade partners in the future.
As the Chinese economy evolves (and potentially weakens), its relationships with both allies and potential enemies may only grow more complex.

This article was published as a part of Visual Capitalist's Creator Program, which features data-driven visuals from some of our favorite Creators around the world.


United States
Visualizing the Most Common Pets in the U.S.
Lions, tigers, and bears, oh my!—these animals do not feature on this list of popular American household pets.


Visualizing The Most Common Pets in the U.S.
This was originally posted on our Voronoi app. Download the app for free on iOS or Android and discover incredible data-driven charts from a variety of trusted sources.
In this graphic, we visualized the most common American household pets, based on 2023-2024 data from the American Pet Products Association (accessed via Forbes Advisor).
Figures represent the number of households that own each pet type, rather than the actual number of each animal. The “small animal” category includes hamsters, gerbils, rabbits, guinea pigs, chinchillas, mice, rats, and ferrets.
What is the Most Popular American Household Pet?
Based on this data, dogs—one of the first domesticated animals—are the most common pets in the United States. In fact, around 65 million households own a dog, and spend an average of $900 a year on their care.
| Rank | Species | Households |
|---|---|---|
| 1 | 🐶 Dog | 65M |
| 2 | 🐱 Cat | 47M |
| 3 | 🐟 Freshwater Fish | 11M |
| 4 | 🐰 Small Animals | 7M |
| 5 | 🐦 Bird | 6M |
| 6 | 🦎 Reptile | 6M |
| 7 | 🐴 Horse | 2M |
| 8 | 🐠 Saltwater Fish | 2M |
Note: Households can own multiple pets, and are counted for all relevant categories.
Cats rank second, at 47 million households, and these smaller felines are a little less expensive to own at $700/year according to Forbes estimates.
But aside from these two juggernauts, there are plenty of other common pet types found in households across the country.
Freshwater fish can be found in 11 million households, along with small animals—rabbits, hamsters, guinea pigs—in 7 million. Meanwhile, nearly 6 million homes have birds or reptiles.
Pet Ownership is on the Rise in America
Forbes found that 66% of all American households (numbering 87 million) own at least one pet, up from 56% in 1988. One third of these (29 million) own multiple pets.
A combination of factors is driving this increase: rising incomes, delayed childbirth, and of course the impact of the pandemic which nearly cleared out animal shelters across the globe.
America’s loneliness epidemic may also be a factor. Fledgling research has shown that single-individual households with pets recorded lower rates of loneliness during the pandemic than those without a pet.

-

 Sports1 week ago
The Highest Earning Athletes in Seven Professional Sports
-

 Countries2 weeks ago
Population Projections: The World’s 6 Largest Countries in 2075
-

 Markets2 weeks ago
The Top 10 States by Real GDP Growth in 2023
-

 Demographics2 weeks ago
The Smallest Gender Wage Gaps in OECD Countries
-

 United States2 weeks ago
Where U.S. Inflation Hit the Hardest in March 2024
-

 Green2 weeks ago
Top Countries By Forest Growth Since 2001
-

 United States2 weeks ago
Ranked: The Largest U.S. Corporations by Number of Employees
-

 Maps2 weeks ago
The Largest Earthquakes in the New York Area (1970-2024)