Markets
Visualizing China’s Most Ambitious Megaproject
View a high resolution version of this graphic
Visualizing China’s Most Ambitious Megaproject
View the high resolution version of today’s graphic by clicking here.
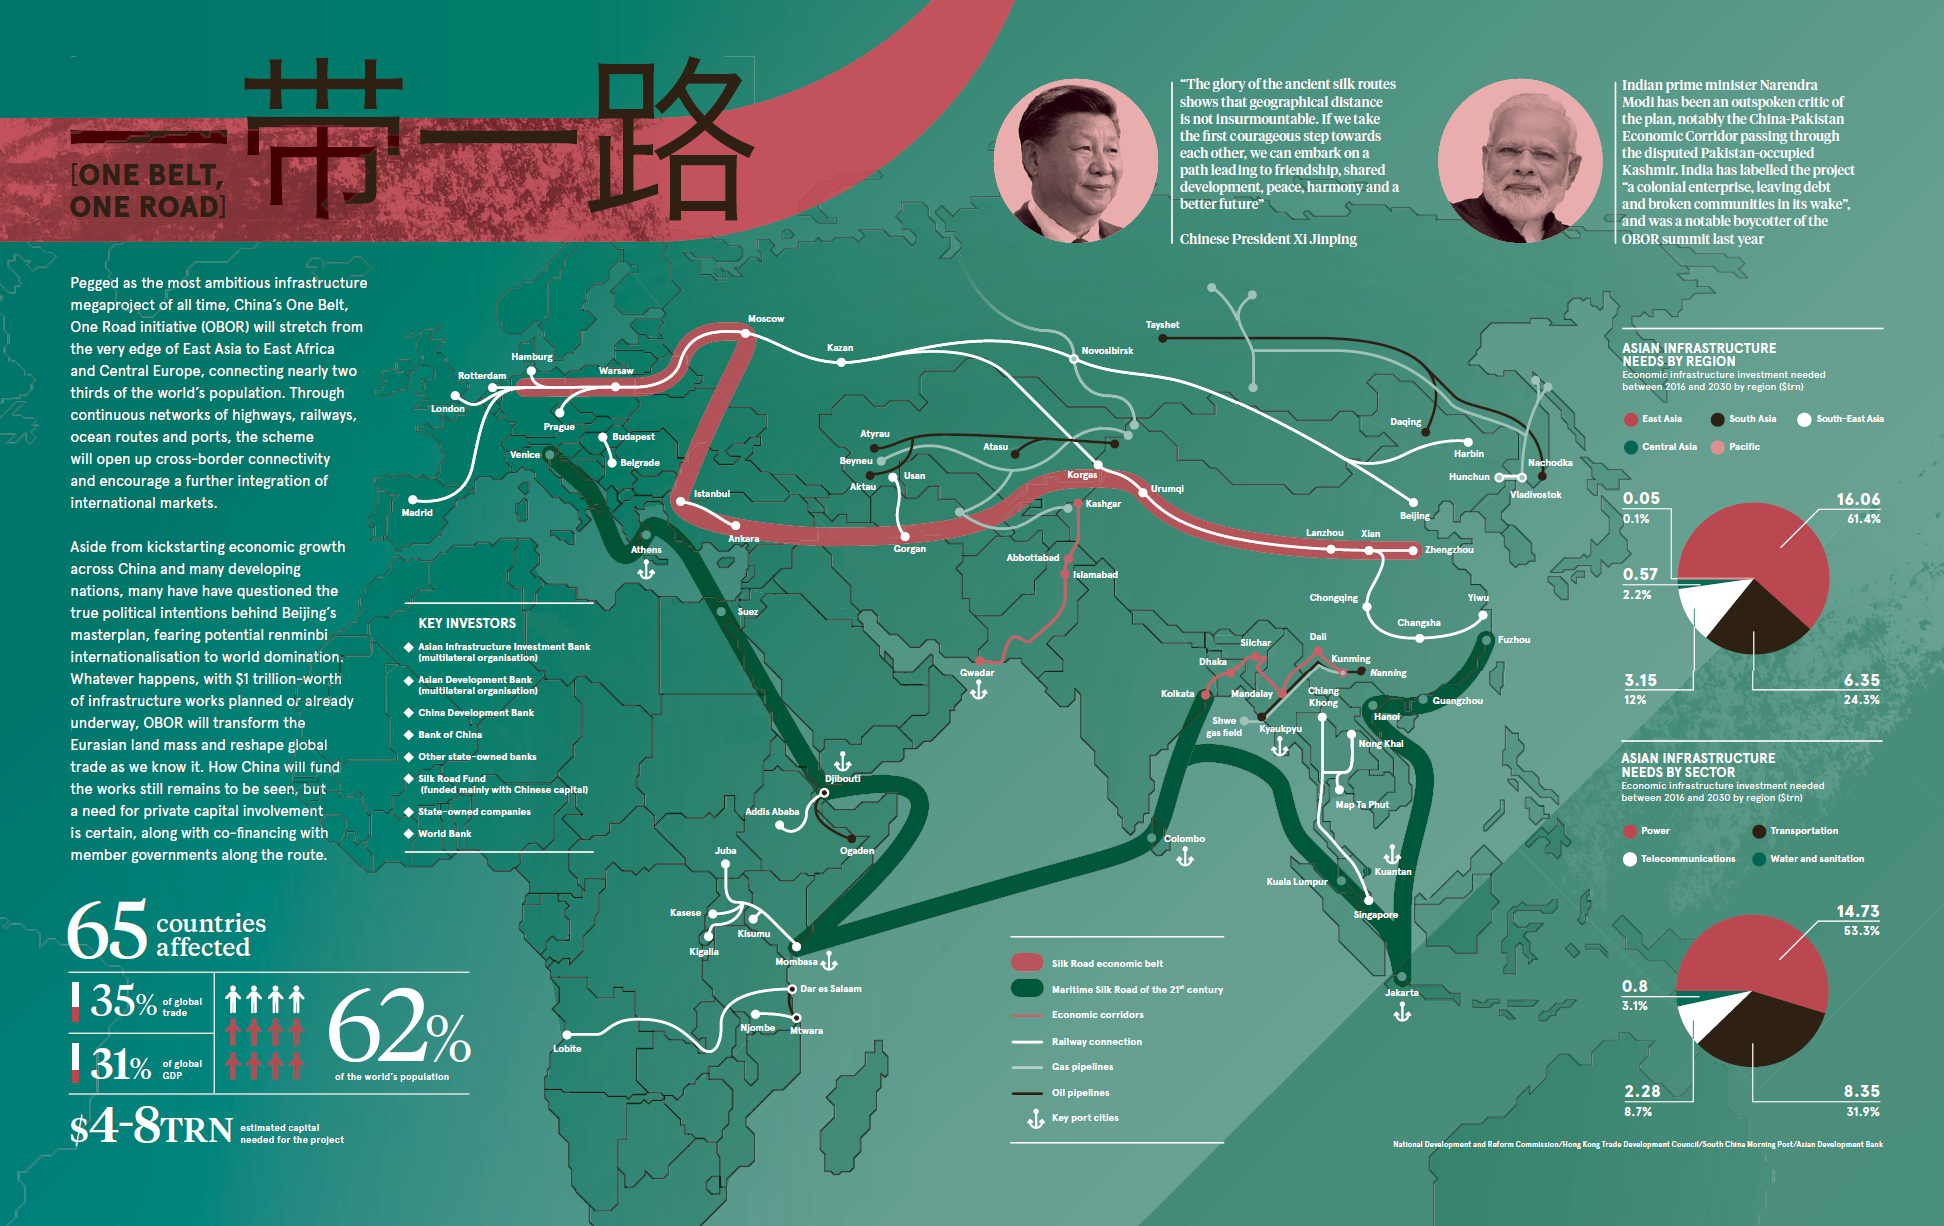
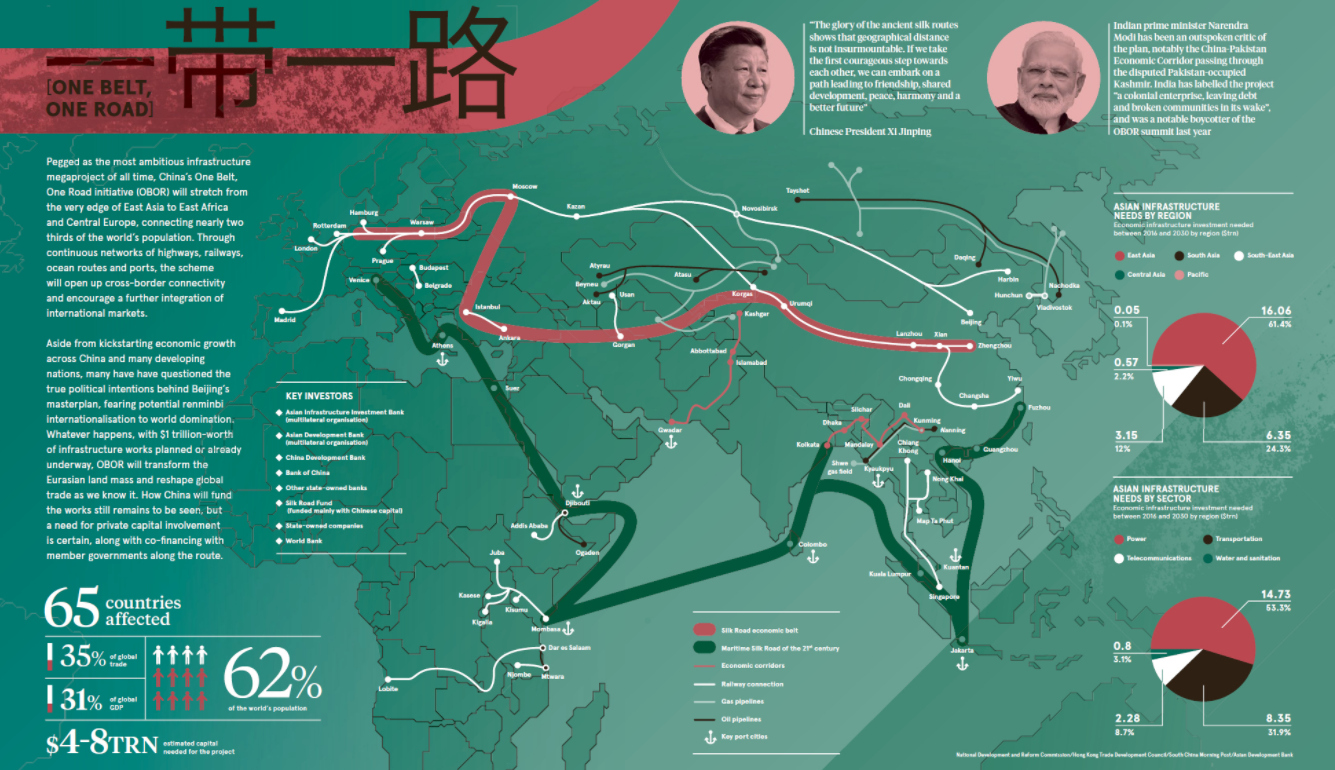
Costing between $4-8 trillion and affecting 65 countries, China’s ambitious One Belt, One Road (OBOR) initiative is the granddaddy of all megaprojects.
By the time of it’s estimated completion in 2049, OBOR will stretch from the edge of East Asia all the way to East Africa and Central Europe, and it will impact a lengthy list of countries that account for 62% of the world’s population and 40% of its economic output.
Today’s infographic from Raconteur helps visualize the initiative’s tremendous size, scale, and potential impact on Asian infrastructure.
Silk Road 2.0
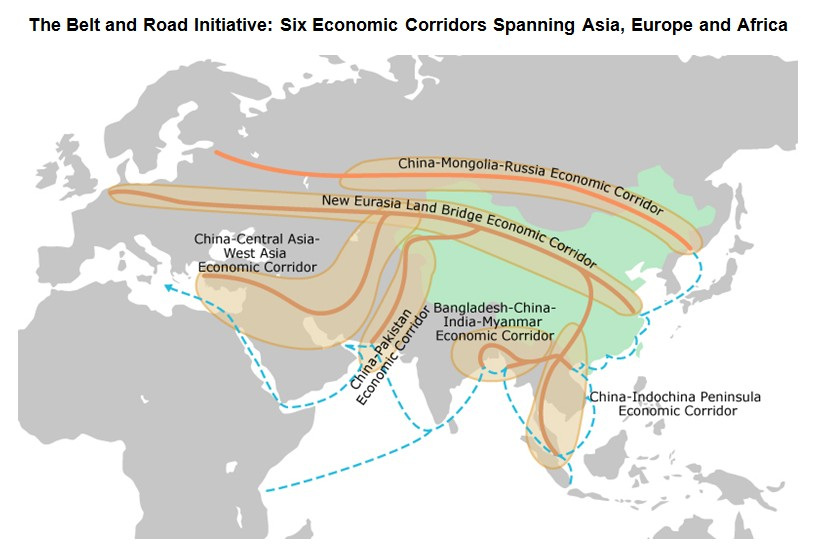
The tangible concept behind OBOR is to build an extensive network of infrastructure – including railways, roads, pipelines, and utility grids – that help link China to the rest of Asia, as well as Africa and Europe.
This multi-trillion dollar project will fill the infrastructure gap that currently inhibits economic growth potential on the world’s largest continent, but it has other important objectives as well. By connecting all of these economies together, China is hoping to become the gatekeeper for a new platform international trade cooperation and integration.
But that’s not all: if China’s economic corridor does what it’s supposed to, the countries in it will see more social and cultural links, financial cooperation, and a merger of policy goals and objectives to accomplish.
Naturally, this will expand the clout and influence of China, and it may even create the eventual scaffolding for the renminbi to flourish as a trade currency, and eventually a reserve currency.
One Road or Roadblock?
When billions of dollars are at play, the stakes become higher. Although some countries agree with the OBOR initiative in principle – how it plays out in reality is a different story.
Most of the funding for massive deep-water ports, lengthy railroads, and power plants will be coming from the purse strings of Chinese companies. Some will be grants, but many are taking the form of loans, and when countries default there can be consequences.
In Pakistan, for example, a deep-water port in Gwadar is being funded by loans from Chinese banks to the tune of $16 billion. The only problem? The interest rate is over 13%, and if Pakistan defaults, China could end up taking all sorts of collateral as compensation – from coal mines to oil pipelines.
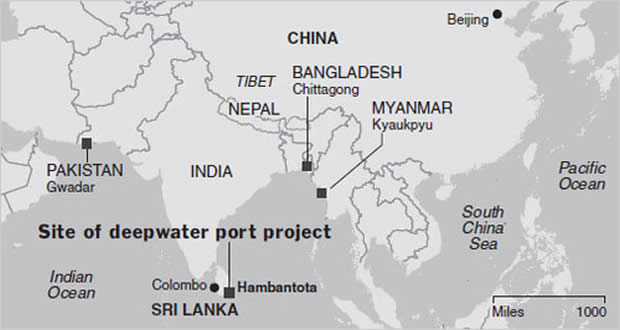
Meanwhile, Sri Lanka was unable to pay its $8 billion loan for the Hambantota Port. In the middle of 2017, the country gave up the controlling interest in the port to a state-owned company in China in exchange for writing off the debt. China now has a 99-year lease on the asset – quite useful, since it happens to be right in the middle of one of China’s most important shipping lanes to Africa, the Middle East, and Europe.
Natural Opposition
While most economies in Asia are willing to accept some level of risk to develop OBOR, there is one country that is simply not a fan of the megaproject.
India, a very natural rival to China, has a few major qualms:
- The China-Pakistan Economic Corridor (CPEC) goes right through Kashmir, a disputed territory
- Chinese investment in maritime trade routes through the Indian Ocean could displace India’s traditional regional dominance
- India sees the OBOR megaproject as lacking transparency
Meanwhile, with neighboring states such as Sri Lanka and Pakistan getting billions of dollars of investment from Chinese state-run companies, it likely creates one more issue that Indian Prime Minister Modi is not necessarily happy about, either.


Markets
U.S. Debt Interest Payments Reach $1 Trillion
U.S. debt interest payments have surged past the $1 trillion dollar mark, amid high interest rates and an ever-expanding debt burden.


U.S. Debt Interest Payments Reach $1 Trillion
This was originally posted on our Voronoi app. Download the app for free on iOS or Android and discover incredible data-driven charts from a variety of trusted sources.
The cost of paying for America’s national debt crossed the $1 trillion dollar mark in 2023, driven by high interest rates and a record $34 trillion mountain of debt.
Over the last decade, U.S. debt interest payments have more than doubled amid vast government spending during the pandemic crisis. As debt payments continue to soar, the Congressional Budget Office (CBO) reported that debt servicing costs surpassed defense spending for the first time ever this year.
This graphic shows the sharp rise in U.S. debt payments, based on data from the Federal Reserve.
A $1 Trillion Interest Bill, and Growing
Below, we show how U.S. debt interest payments have risen at a faster pace than at another time in modern history:
| Date | Interest Payments | U.S. National Debt |
|---|---|---|
| 2023 | $1.0T | $34.0T |
| 2022 | $830B | $31.4T |
| 2021 | $612B | $29.6T |
| 2020 | $518B | $27.7T |
| 2019 | $564B | $23.2T |
| 2018 | $571B | $22.0T |
| 2017 | $493B | $20.5T |
| 2016 | $460B | $20.0T |
| 2015 | $435B | $18.9T |
| 2014 | $442B | $18.1T |
| 2013 | $425B | $17.2T |
| 2012 | $417B | $16.4T |
| 2011 | $433B | $15.2T |
| 2010 | $400B | $14.0T |
| 2009 | $354B | $12.3T |
| 2008 | $380B | $10.7T |
| 2007 | $414B | $9.2T |
| 2006 | $387B | $8.7T |
| 2005 | $355B | $8.2T |
| 2004 | $318B | $7.6T |
| 2003 | $294B | $7.0T |
| 2002 | $298B | $6.4T |
| 2001 | $318B | $5.9T |
| 2000 | $353B | $5.7T |
| 1999 | $353B | $5.8T |
| 1998 | $360B | $5.6T |
| 1997 | $368B | $5.5T |
| 1996 | $362B | $5.3T |
| 1995 | $357B | $5.0T |
| 1994 | $334B | $4.8T |
| 1993 | $311B | $4.5T |
| 1992 | $306B | $4.2T |
| 1991 | $308B | $3.8T |
| 1990 | $298B | $3.4T |
| 1989 | $275B | $3.0T |
| 1988 | $254B | $2.7T |
| 1987 | $240B | $2.4T |
| 1986 | $225B | $2.2T |
| 1985 | $219B | $1.9T |
| 1984 | $205B | $1.7T |
| 1983 | $176B | $1.4T |
| 1982 | $157B | $1.2T |
| 1981 | $142B | $1.0T |
| 1980 | $113B | $930.2B |
| 1979 | $96B | $845.1B |
| 1978 | $84B | $789.2B |
| 1977 | $69B | $718.9B |
| 1976 | $61B | $653.5B |
| 1975 | $55B | $576.6B |
| 1974 | $50B | $492.7B |
| 1973 | $45B | $469.1B |
| 1972 | $39B | $448.5B |
| 1971 | $36B | $424.1B |
| 1970 | $35B | $389.2B |
| 1969 | $30B | $368.2B |
| 1968 | $25B | $358.0B |
| 1967 | $23B | $344.7B |
| 1966 | $21B | $329.3B |
Interest payments represent seasonally adjusted annual rate at the end of Q4.
At current rates, the U.S. national debt is growing by a remarkable $1 trillion about every 100 days, equal to roughly $3.6 trillion per year.
As the national debt has ballooned, debt payments even exceeded Medicaid outlays in 2023—one of the government’s largest expenditures. On average, the U.S. spent more than $2 billion per day on interest costs last year. Going further, the U.S. government is projected to spend a historic $12.4 trillion on interest payments over the next decade, averaging about $37,100 per American.
Exacerbating matters is that the U.S. is running a steep deficit, which stood at $1.1 trillion for the first six months of fiscal 2024. This has accelerated due to the 43% increase in debt servicing costs along with a $31 billion dollar increase in defense spending from a year earlier. Additionally, a $30 billion increase in funding for the Federal Deposit Insurance Corporation in light of the regional banking crisis last year was a major contributor to the deficit increase.
Overall, the CBO forecasts that roughly 75% of the federal deficit’s increase will be due to interest costs by 2034.

-

 Green2 weeks ago
Ranked: Top Countries by Total Forest Loss Since 2001
-

 Travel1 week ago
Ranked: The World’s Top Flight Routes, by Revenue
-

 Technology2 weeks ago
Ranked: Semiconductor Companies by Industry Revenue Share
-

 Money2 weeks ago
Which States Have the Highest Minimum Wage in America?
-

 Real Estate2 weeks ago
Ranked: The Most Valuable Housing Markets in America
-

 Markets2 weeks ago
Charted: Big Four Market Share by S&P 500 Audits
-

 AI2 weeks ago
The Stock Performance of U.S. Chipmakers So Far in 2024
-

 Automotive2 weeks ago
Almost Every EV Stock is Down After Q1 2024