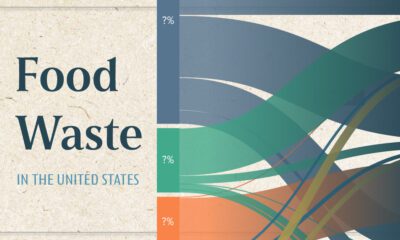

This chart visualizes the flow of the 80 millions tons of food waste in the United States in 2021, using data from ReFED.
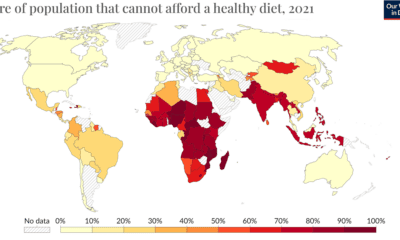

The wash of red in Africa, South Asia, and Southeast Asia indicates the regions where food unaffordability is at its peak.


Which foods are linked with high CO2 emissions and high water use? We look at the environmental impacts of food production in this chart.
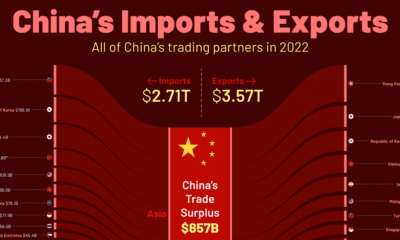

China trades with more than 200 countries globally. Here's how China's trade partners break down by import and export destinations.
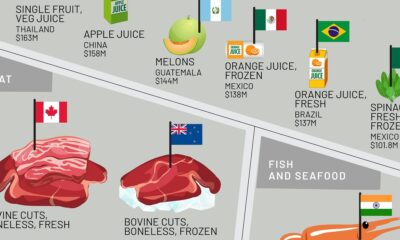

This infographic shows the top exporting countries for U.S. food imports, ranging from exotic fruits to meat, oils, spices, and more.
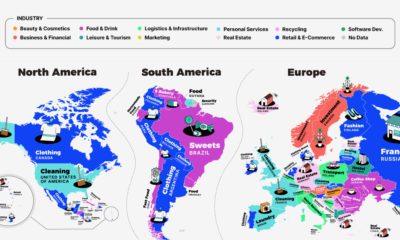

This series of maps shows a regional breakdown of the most popular types of businesses people want to start, based on online search results.
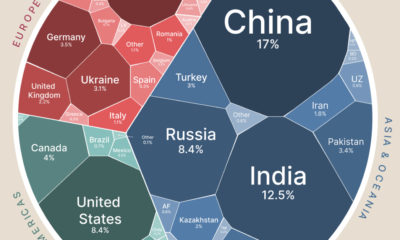

Global wheat production is concentrated in just a handful of countries. Here’s a look at the top wheat-producing countries worldwide.
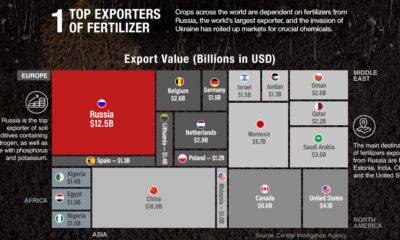

Bad weather, the war in Ukraine, and a shortage of fertilizer have led to fears of a global food crisis. Here are three factors you should...
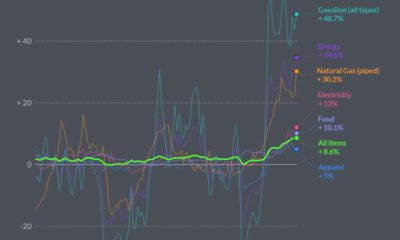

In May 2022, U.S. Inflation was the highest its been since 1981. Here’s a look at which products saw the biggest price jumps.
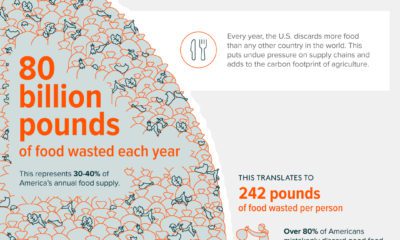

The U.S. produces billions of pounds of food waste every year. View this infographic to learn the most important facts. Sponsored content.


 Creator Program