GDP
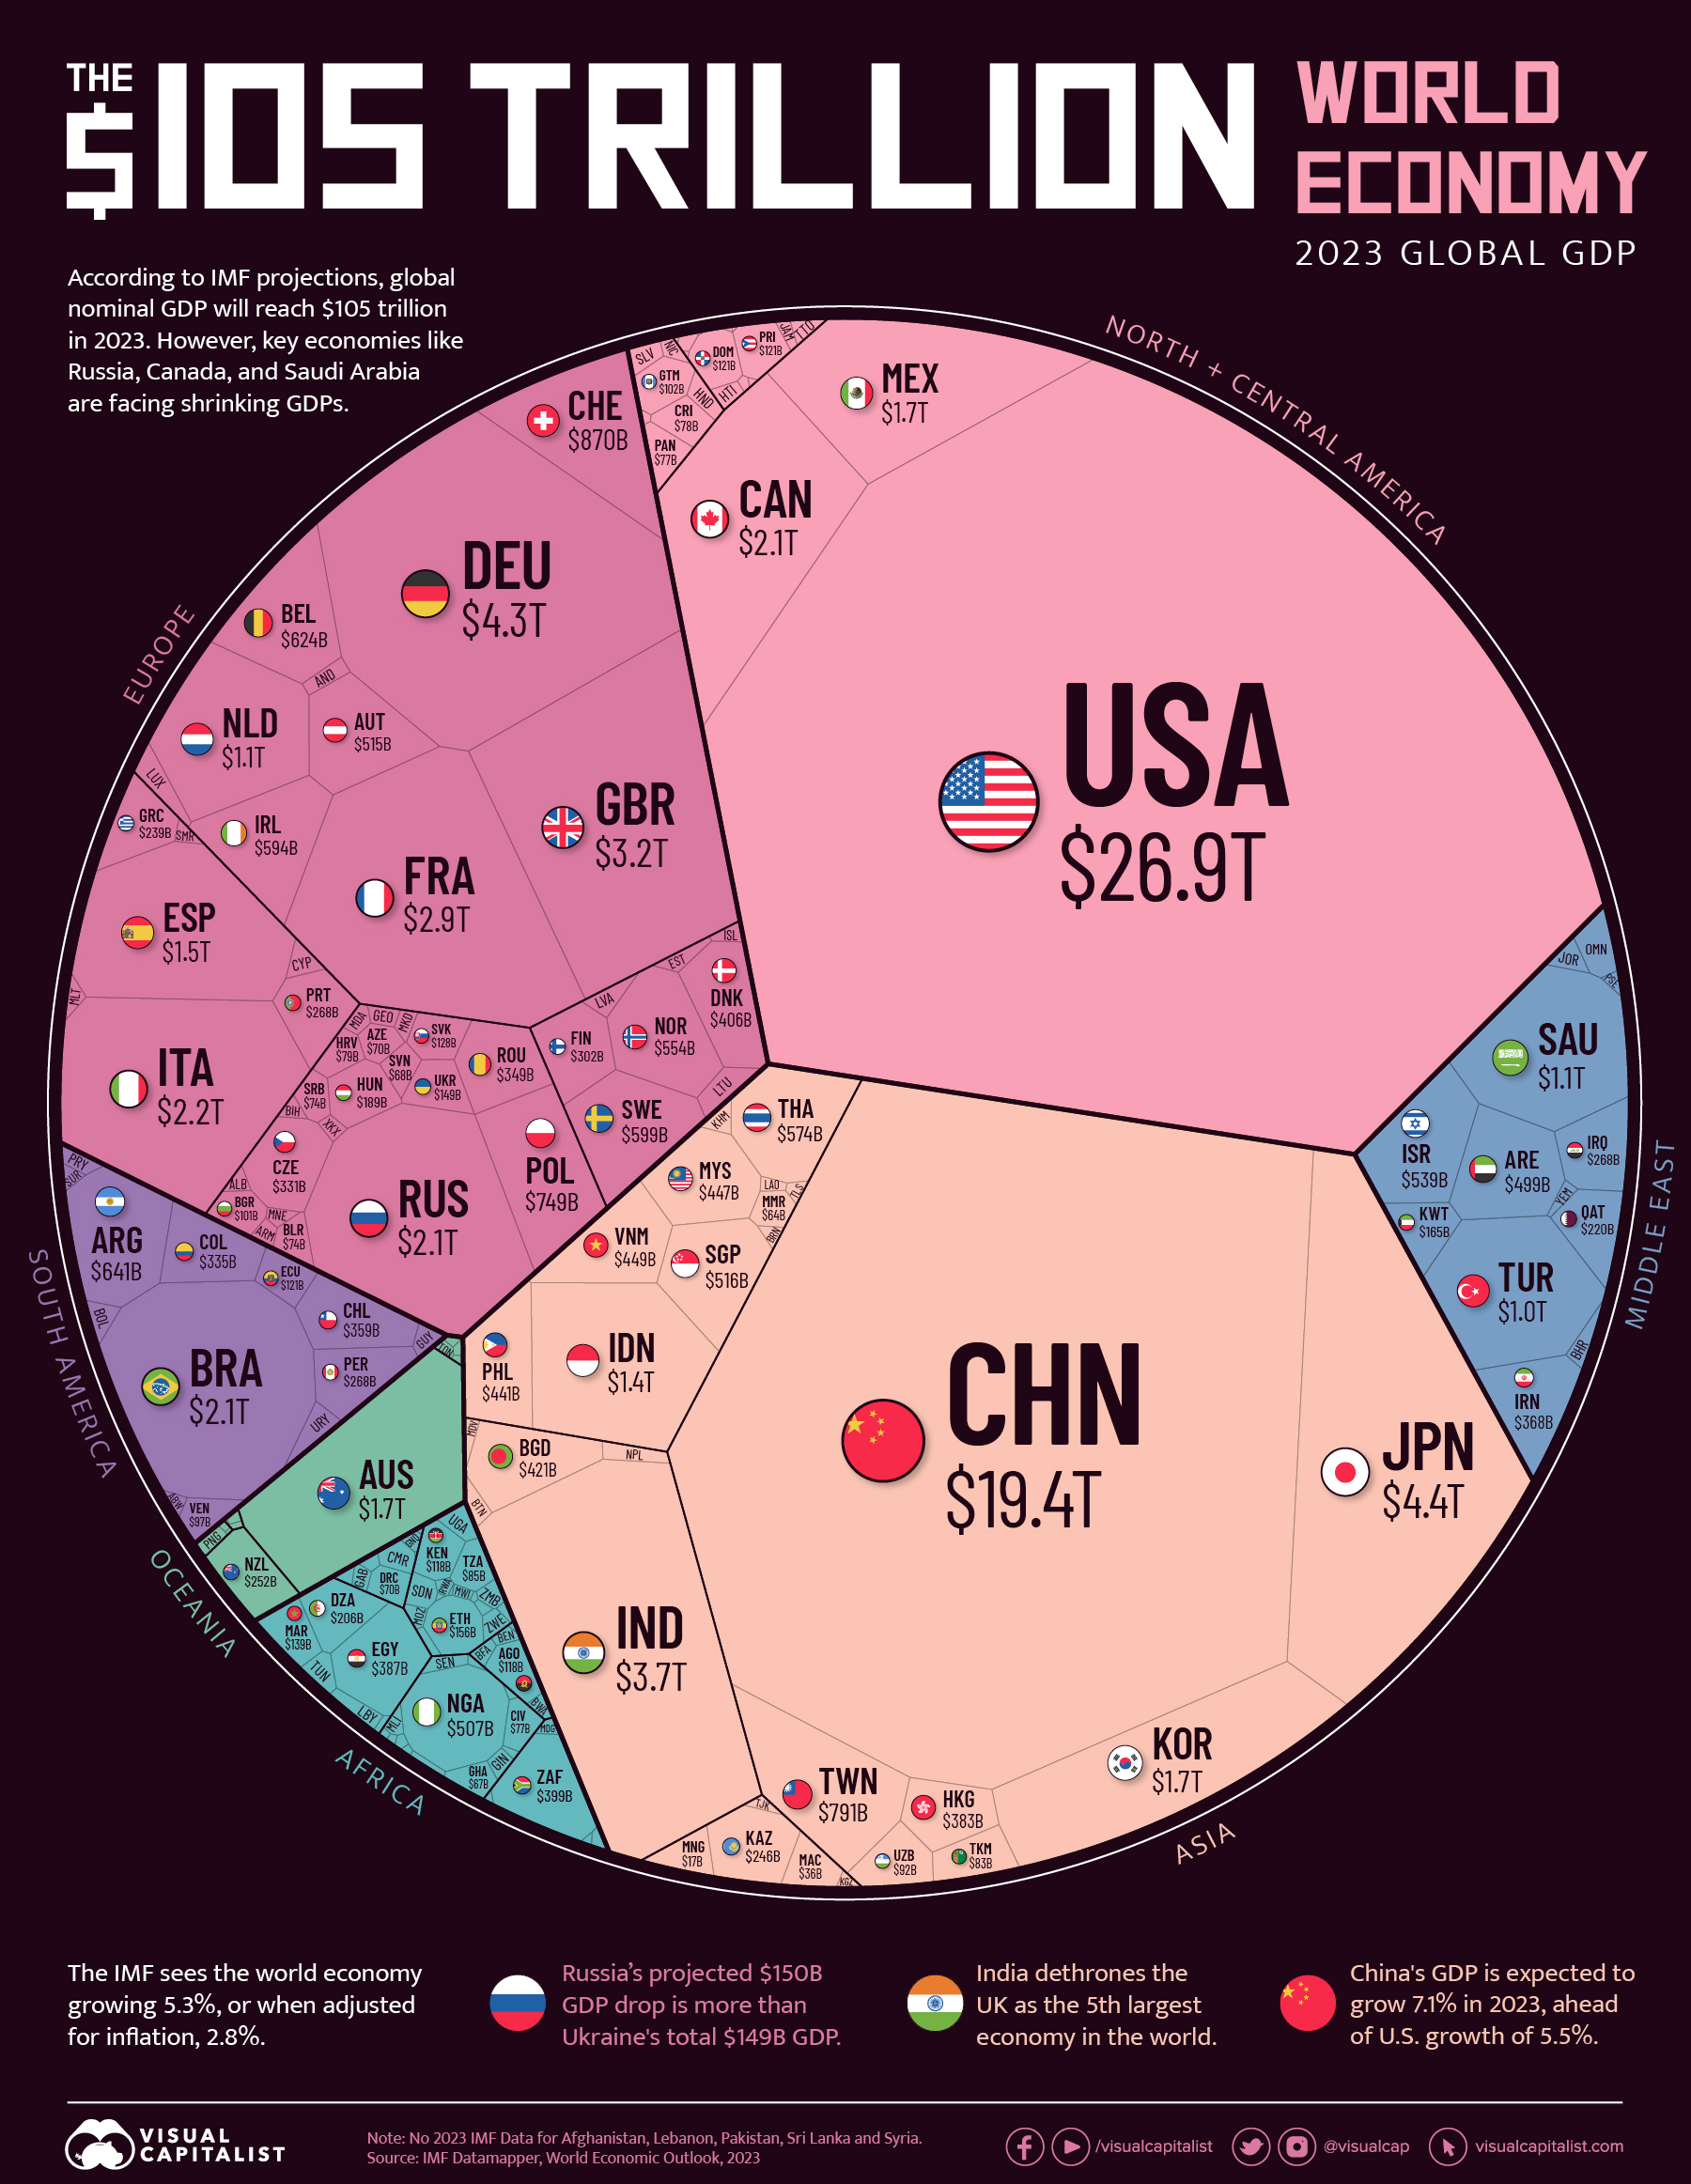
Visualizing the $105 Trillion World Economy in One Chart
Click to view this graphic in a higher-resolution.

 Can I share this graphic?
 When do I need a license?
 Interested in this piece?
Visualizing the $105 Trillion World Economy in One Chart
By the end of 2023, the world economy is expected to have a gross domestic product (GDP) of $105 trillion, or $5 trillion higher than the year before, according to the latest International Monetary Fund (IMF) projections from its 2023 World Economic Outlook report.
In nominal terms, that’s a 5.3% increase in global GDP. In inflation-adjusted terms, that would be a 2.8% increase.
The year started with turmoil for the global economy, with financial markets rocked by the collapse of several mid-sized U.S. banks alongside persistent inflation and tightening monetary conditions in most countries. Nevertheless, some economies have proven to be resilient, and are expected to register growth from 2022.
Ranking Countries by Economic Size in 2023
The U.S. is expected to continue being the biggest economy in 2023 with a projected GDP of $26.9 trillion for the year. This is more than the sum of the GDPs of 174 countries ranked from Indonesia (17th) to Tuvalu (191st).
China stays steady at second place with a projected $19.4 trillion GDP in 2023. Most of the top-five economies remain in the same positions from 2022, with one notable exception.
India is expected to climb past the UK to become the fifth-largest economy with a projected 2023 GDP of $3.7 trillion.
Here’s a look at the size of every country’s economy in 2023, according to IMF’s estimates.
| Rank | Country | GDP (USD) | % of Total |
|---|---|---|---|
| 1 | 🇺🇸 U.S. | $26,855B | 25.54% |
| 2 | 🇨🇳 China | $19,374B | 18.43% |
| 3 | 🇯🇵 Japan | $4,410B | 4.19% |
| 4 | 🇩🇪 Germany | $4,309B | 4.10% |
| 5 | 🇮🇳 India | $3,737B | 3.55% |
| 6 | 🇬🇧 UK | $3,159B | 3.00% |
| 7 | 🇫🇷 France | $2,923B | 2.78% |
| 8 | 🇮🇹 Italy | $2,170B | 2.06% |
| 9 | 🇨🇦 Canada | $2,090B | 1.99% |
| 10 | 🇧🇷 Brazil | $2,081B | 1.98% |
| 11 | 🇷🇺 Russia | $2,063B | 1.96% |
| 12 | 🇰🇷 South Korea | $1,722B | 1.64% |
| 13 | 🇦🇺 Australia | $1,708B | 1.62% |
| 14 | 🇲🇽 Mexico | $1,663B | 1.58% |
| 15 | 🇪🇸 Spain | $1,492B | 1.42% |
| 16 | 🇮🇩 Indonesia | $1,392B | 1.32% |
| 17 | 🇳🇱 Netherlands | $1,081B | 1.03% |
| 18 | 🇸🇦 Saudi Arabia | $1,062B | 1.01% |
| 19 | 🇹🇷 Türkiye | $1,029B | 0.98% |
| 20 | 🇨🇭 Switzerland | $870B | 0.83% |
| 21 | 🇹🇼 Taiwan | $791B | 0.75% |
| 22 | 🇵🇱 Poland | $749B | 0.71% |
| 23 | 🇦🇷 Argentina | $641B | 0.61% |
| 24 | 🇧🇪 Belgium | $624B | 0.59% |
| 25 | 🇸🇪 Sweden | $599B | 0.57% |
| 26 | 🇮🇪 Ireland | $594B | 0.57% |
| 27 | 🇹🇭 Thailand | $574B | 0.55% |
| 28 | 🇳🇴 Norway | $554B | 0.53% |
| 29 | 🇮🇱 Israel | $539B | 0.51% |
| 30 | 🇸🇬 Singapore | $516B | 0.49% |
| 31 | 🇦🇹 Austria | $515B | 0.49% |
| 32 | 🇳🇬 Nigeria | $507B | 0.48% |
| 33 | 🇦🇪 UAE | $499B | 0.47% |
| 34 | 🇻🇳 Vietnam | $449B | 0.43% |
| 35 | 🇲🇾 Malaysia | $447B | 0.43% |
| 36 | 🇵🇭 Philippines | $441B | 0.42% |
| 37 | 🇧🇩 Bangladesh | $421B | 0.40% |
| 38 | 🇩🇰 Denmark | $406B | 0.39% |
| 39 | 🇿🇦 South Africa | $399B | 0.38% |
| 40 | 🇪🇬 Egypt | $387B | 0.37% |
| 41 | 🇭🇰 Hong Kong | $383B | 0.36% |
| 42 | 🇮🇷 Iran | $368B | 0.35% |
| 43 | 🇨🇱 Chile | $359B | 0.34% |
| 44 | 🇷🇴 Romania | $349B | 0.33% |
| 45 | 🇨🇴 Colombia | $335B | 0.32% |
| 46 | 🇨🇿 Czech Republic | $330B | 0.31% |
| 47 | 🇫🇮 Finland | $302B | 0.29% |
| 48 | 🇵🇪 Peru | $268B | 0.26% |
| 49 | 🇮🇶 Iraq | $268B | 0.25% |
| 50 | 🇵🇹 Portugal | $268B | 0.25% |
| 51 | 🇳🇿 New Zealand | $252B | 0.24% |
| 52 | 🇰🇿 Kazakhstan | $246B | 0.23% |
| 53 | 🇬🇷 Greece | $239B | 0.23% |
| 54 | 🇶🇦 Qatar | $220B | 0.21% |
| 55 | 🇩🇿 Algeria | $206B | 0.20% |
| 56 | 🇭🇺 Hungary | $189B | 0.18% |
| 57 | 🇰🇼 Kuwait | $165B | 0.16% |
| 58 | 🇪🇹 Ethiopia | $156B | 0.15% |
| 59 | 🇺🇦 Ukraine | $149B | 0.14% |
| 60 | 🇲🇦 Morocco | $139B | 0.13% |
| 61 | 🇸🇰 Slovak Republic | $128B | 0.12% |
| 62 | 🇪🇨 Ecuador | $121B | 0.12% |
| 63 | 🇩🇴 Dominican Republic | $121B | 0.12% |
| 64 | 🇵🇷 Puerto Rico | $121B | 0.11% |
| 65 | 🇰🇪 Kenya | $118B | 0.11% |
| 66 | 🇦🇴 Angola | $118B | 0.11% |
| 67 | 🇴🇲 Oman | $105B | 0.10% |
| 68 | 🇬🇹 Guatemala | $102B | 0.10% |
| 69 | 🇧🇬 Bulgaria | $101B | 0.10% |
| 70 | 🇻🇪 Venezuela | $97B | 0.09% |
| 71 | 🇺🇿 Uzbekistan | $92B | 0.09% |
| 72 | 🇱🇺 Luxembourg | $87B | 0.08% |
| 73 | 🇹🇿 Tanzania | $85B | 0.08% |
| 74 | 🇹🇲 Turkmenistan | $83B | 0.08% |
| 75 | 🇭🇷 Croatia | $79B | 0.08% |
| 76 | 🇱🇹 Lithuania | $78B | 0.07% |
| 77 | 🇨🇷 Costa Rica | $78B | 0.07% |
| 78 | 🇺🇾 Uruguay | $77B | 0.07% |
| 79 | 🇵🇦 Panama | $77B | 0.07% |
| 80 | 🇨🇮 Côte d'Ivoire | $77B | 0.07% |
| 81 | 🇷🇸 Serbia | $74B | 0.07% |
| 82 | 🇧🇾 Belarus | $74B | 0.07% |
| 83 | 🇦🇿 Azerbaijan | $70B | 0.07% |
| 84 | 🇨🇩 DRC | $69B | 0.07% |
| 85 | 🇸🇮 Slovenia | $68B | 0.06% |
| 86 | 🇬🇭 Ghana | $67B | 0.06% |
| 87 | 🇲🇲 Myanmar | $64B | 0.06% |
| 88 | 🇯🇴 Jordan | $52B | 0.05% |
| 89 | 🇹🇳 Tunisia | $50B | 0.05% |
| 90 | 🇺🇬 Uganda | $50B | 0.05% |
| 91 | 🇨🇲 Cameroon | $49B | 0.05% |
| 92 | 🇱🇻 Latvia | $47B | 0.05% |
| 93 | 🇸🇩 Sudan | $47B | 0.04% |
| 94 | 🇱🇾 Libya | $46B | 0.04% |
| 95 | 🇧🇴 Bolivia | $46B | 0.04% |
| 96 | 🇧🇭 Bahrain | $45B | 0.04% |
| 97 | 🇵🇾 Paraguay | $43B | 0.04% |
| 98 | 🇳🇵 Nepal | $42B | 0.04% |
| 99 | 🇪🇪 Estonia | $42B | 0.04% |
| 100 | 🇲🇴 Macao | $36B | 0.03% |
| 101 | 🇭🇳 Honduras | $34B | 0.03% |
| 102 | 🇸🇻 El Salvador | $34B | 0.03% |
| 103 | 🇵🇬 Papua New Guinea | $33B | 0.03% |
| 104 | 🇸🇳 Senegal | $31B | 0.03% |
| 105 | 🇨🇾 Cyprus | $31B | 0.03% |
| 106 | 🇰🇭 Cambodia | $31B | 0.03% |
| 107 | 🇿🇼 Zimbabwe | $30B | 0.03% |
| 108 | 🇿🇲 Zambia | $29B | 0.03% |
| 109 | 🇮🇸 Iceland | $29B | 0.03% |
| 110 | 🇧🇦 Bosnia & Herzegovina | $28B | 0.03% |
| 111 | 🇹🇹 Trinidad & Tobago | $28B | 0.03% |
| 112 | 🇬🇪 Georgia | $28B | 0.03% |
| 113 | 🇭🇹 Haiti | $27B | 0.03% |
| 114 | 🇦🇲 Armenia | $24B | 0.02% |
| 115 | 🇬🇳 Guinea | $23B | 0.02% |
| 116 | 🇧🇫 Burkina Faso | $21B | 0.02% |
| 117 | 🇲🇱 Mali | $21B | 0.02% |
| 118 | 🇬🇦 Gabon | $20B | 0.02% |
| 119 | 🇦🇱 Albania | $20B | 0.02% |
| 120 | 🇲🇿 Mozambique | $20B | 0.02% |
| 121 | 🇧🇼 Botswana | $20B | 0.02% |
| 122 | 🇾🇪 Yemen | $20B | 0.02% |
| 123 | 🇲🇹 Malta | $19B | 0.02% |
| 124 | 🇧🇯 Benin | $19B | 0.02% |
| 125 | 🇵🇸 West Bank & Gaza | $19B | 0.02% |
| 126 | 🇳🇮 Nicaragua | $17B | 0.02% |
| 127 | 🇯🇲 Jamaica | $17B | 0.02% |
| 128 | 🇲🇳 Mongolia | $17B | 0.02% |
| 129 | 🇳🇪 Niger | $17B | 0.02% |
| 130 | 🇬🇾 Guyana | $16B | 0.02% |
| 131 | 🇲🇬 Madagascar | $16B | 0.02% |
| 132 | 🇲🇩 Moldova | $16B | 0.02% |
| 133 | 🇧🇳 Brunei Darussalam | $16B | 0.01% |
| 134 | 🇲🇰 North Macedonia | $15B | 0.01% |
| 135 | 🇬🇶 Equatorial Guinea | $15B | 0.01% |
| 136 | 🇲🇺 Mauritius | $15B | 0.01% |
| 137 | 🇧🇸 Bahamas | $14B | 0.01% |
| 138 | 🇱🇦 Laos | $14B | 0.01% |
| 139 | 🇳🇦 Namibia | $13B | 0.01% |
| 140 | 🇷🇼 Rwanda | $13B | 0.01% |
| 141 | 🇨🇩 Congo | $13B | 0.01% |
| 142 | 🇹🇯 Tajikistan | $13B | 0.01% |
| 143 | 🇰🇬 Kyrgyz Republic | $12B | 0.01% |
| 144 | 🇹🇩 Chad | $12B | 0.01% |
| 145 | 🇲🇼 Malawi | $11B | 0.01% |
| 146 | 🇲🇷 Mauritania | $11B | 0.01% |
| 147 | 🇽🇰 Kosovo | $10B | 0.01% |
| 148 | 🇹🇬 Togo | $9B | 0.01% |
| 149 | 🇸🇴 Somalia | $9B | 0.01% |
| 150 | 🇲🇪 Montenegro | $7B | 0.01% |
| 151 | 🇸🇸 South Sudan | $7B | 0.01% |
| 152 | 🇲🇻 Maldives | $7B | 0.01% |
| 153 | 🇧🇧 Barbados | $6B | 0.01% |
| 154 | 🇫🇯 Fiji | $5B | 0.01% |
| 155 | 🇸🇿 Eswatini | $5B | 0.00% |
| 156 | 🇱🇷 Liberia | $4B | 0.00% |
| 157 | 🇩🇯 Djibouti | $4B | 0.00% |
| 158 | 🇦🇩 Andorra | $4B | 0.00% |
| 159 | 🇦🇼 Aruba | $4B | 0.00% |
| 160 | 🇸🇱 Sierra Leone | $4B | 0.00% |
| 161 | 🇸🇷 Suriname | $3B | 0.00% |
| 162 | 🇧🇮 Burundi | $3B | 0.00% |
| 163 | 🇧🇿 Belize | $3B | 0.00% |
| 164 | 🇨🇫 Central African Republic | $3B | 0.00% |
| 165 | 🇧🇹 Bhutan | $3B | 0.00% |
| 166 | 🇪🇷 Eritrea | $3B | 0.00% |
| 167 | 🇱🇸 Lesotho | $3B | 0.00% |
| 168 | 🇨🇻 Cabo Verde | $2B | 0.00% |
| 169 | 🇬🇲 Gambia | $2B | 0.00% |
| 170 | 🇱🇨 Saint Lucia | $2B | 0.00% |
| 171 | 🇹🇱 East Timor | $2B | 0.00% |
| 172 | 🇸🇨 Seychelles | $2B | 0.00% |
| 173 | 🇬🇼 Guinea-Bissau | $2B | 0.00% |
| 174 | 🇦🇬 Antigua & Barbuda | $2B | 0.00% |
| 175 | 🇸🇲 San Marino | $2B | 0.00% |
| 176 | 🇸🇧 Solomon Islands | $2B | 0.00% |
| 177 | 🇰🇲 Comoros | $1B | 0.00% |
| 178 | 🇬🇩 Grenada | $1B | 0.00% |
| 179 | 🇻🇺 Vanuatu | $1B | 0.00% |
| 180 | 🇰🇳 Saint Kitts & Nevis | $1B | 0.00% |
| 181 | 🇻🇨 Saint Vincent & the Grenadines | $1B | 0.00% |
| 182 | 🇼🇸 Samoa | $1B | 0.00% |
| 183 | 🇩🇲 Dominica | $1B | 0.00% |
| 184 | 🇸🇹 São Tomé & Príncipe | $1B | 0.00% |
| 185 | 🇹🇴 Tonga | $1B | 0.00% |
| 186 | 🇫🇲 Micronesia | $0.5B | 0.00% |
| 187 | 🇲🇭 Marshall Islands | $0.3B | 0.00% |
| 188 | 🇵🇼 Palau | $0.3B | 0.00% |
| 189 | 🇰🇮 Kiribati | $0.2B | 0.00% |
| 190 | 🇳🇷 Nauru | $0.2B | 0.00% |
| 191 | 🇹🇻 Tuvalu | $0.1B | 0.00% |
Note: Projections for Afghanistan, Lebanon, Pakistan, Sri Lanka and Syria are missing from IMF’s database for 2023.
Here are the largest economies for each region of the world.
- Africa: Nigeria ($506.6 billion)
- Asia: China ($19.4 trillion)
- Europe: Germany ($4.3 trillion)
- Middle East: Saudi Arabia ($1.1 trillion)
- North & Central America: U.S. ($26.9 trillion)
- Oceania: Australia ($1.7 trillion)
- South America: Brazil ($2.1 trillion)
Ranked: 2023’s Shrinking Economies
In fact, 29 economies are projected to shrink from their 2022 sizes, leading to nearly $500 billion in lost output.
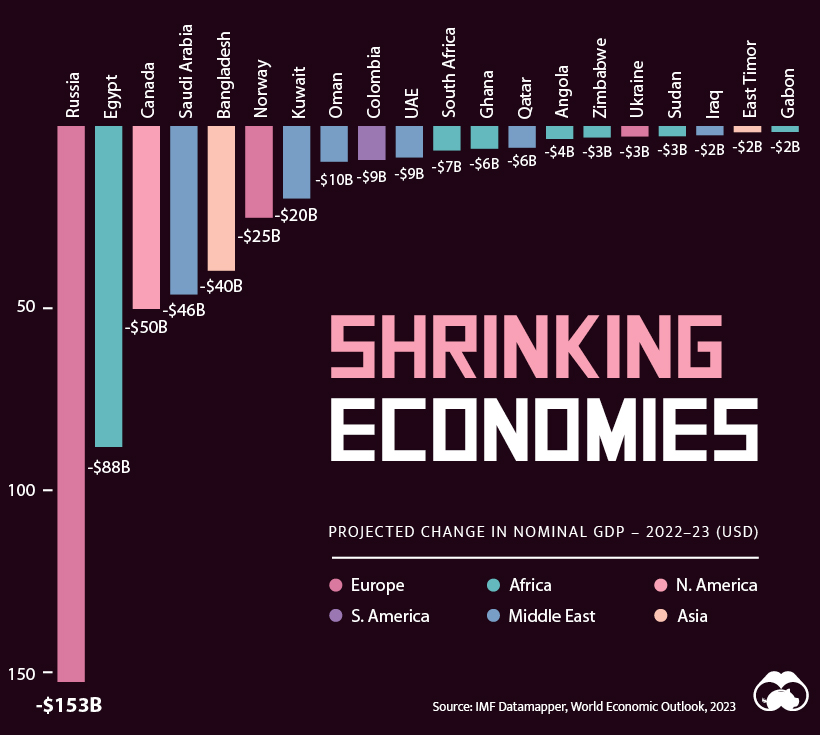
Russia will see the biggest decline, with a projected $150 billion contraction this year. This is equal to about one-third of total decline of all 29 countries with shrinking economies.
Egypt (-$88 billion) and Canada (-$50 billion) combined make up another one-third of lost output.
In Egypt’s case, the drop can be partly explained by the country’s currency (Egyptian pound), which has dropped in value against the U.S. dollar by about 50% since mid-2022.
Russia and Canada are some of the world’s largest oil producers and the oil price has fallen since 2022. A further complication for Russia is that the country has been forced to sell oil at a steep discount because of Western sanctions.
Here are the projected changes in GDP for all countries facing year-over-year declines:
| Country | Region | 2022–23 Change (USD) | 2022–23 Change (%) |
|---|---|---|---|
| 🇷🇺 Russia | Europe | -$152.65B | -6.9% |
| 🇪🇬 Egypt | Africa | -$88.12B | -18.5% |
| 🇨🇦 Canada | North America | -$50.17B | -2.3% |
| 🇸🇦 Saudi Arabia | Middle East | -$46.25B | -4.2% |
| 🇧🇩 Bangladesh | Asia | -$39.69B | -8.6% |
| 🇳🇴 Norway | Europe | -$25.16B | -4.3% |
| 🇰🇼 Kuwait | Middle East | -$19.85B | -10.8% |
| 🇴🇲 Oman | Middle East | -$9.77B | -8.5% |
| 🇨🇴 Colombia | South America | -$9.25B | -2.7% |
| 🇦🇪 UAE | Middle East | -$8.56B | -1.7% |
| 🇿🇦 South Africa | Africa | -$6.69B | -1.6% |
| 🇬🇭 Ghana | Africa | -$6.22B | -8.5% |
| 🇶🇦 Qatar | Middle East | -$5.91B | -2.6% |
| 🇦🇴 Angola | Africa | -$3.54B | -2.9% |
| 🇿🇼 Zimbabwe | Africa | -$3.09B | -9.4% |
| 🇺🇦 Ukraine | Europe | -$2.79B | -1.8% |
| 🇸🇩 Sudan | Africa | -$2.72B | -5.5% |
| 🇮🇶 Iraq | Middle East | -$2.47B | -0.9% |
| 🇹🇱 East Timor | Asia | -$1.67B | -45.7% |
| 🇬🇦 Gabon | Africa | -$1.60B | -7.3% |
| 🇬🇶 Equatorial Guinea | Africa | -$1.35B | -8.2% |
| 🇲🇼 Malawi | Africa | -$1.24B | -9.9% |
| 🇱🇦 Laos | Asia | -$1.21B | -7.9% |
| 🇧🇳 Brunei | Asia | -$1.13B | -6.8% |
| 🇾🇪 Yemen | Middle East | -$1.12B | -5.4% |
| 🇸🇸 South Sudan | Africa | -$0.86B | -10.9% |
| 🇧🇮 Burundi | Africa | -$0.66B | -16.9% |
| 🇸🇱 Sierra Leone | Africa | -$0.42B | -10.6% |
| 🇸🇷 Suriname | South America | -$0.05B | -1.4% |
The presence of Saudi Arabia, Norway, Kuwait, and Oman in the top 10 biggest GDP contractions further highlights the potential impact on GDP for oil-producing countries, according to the IMF’s projections.
More recently, producers have been cutting supply in an effort to boost prices, but concerns of slowing global oil demand in the wake of a subdued Chinese economy (the world’s second-largest oil consumer), have kept oil prices lower than in 2022 regardless.
The Footnote on GDP Forecasts
While organizations like the IMF have gotten fairly good at GDP forecasting, it’s still worth remembering that these are projections and assumptions made at the beginning of the year that may not hold true by the end of 2023.
For example, JP Morgan has already changed their forecast for China’s 2023 real GDP growth six times in as many months after expectations of broad-based pandemic-recovery spending did not materialize in the country.
The key takeaway from IMF’s projections for 2023 GDP growth rests on how well countries restrict inflation without stifling growth, all amidst tense liquidity conditions.
Where Does This Data Come From?
Source: The International Monetary Fund’s Datamapper which uses projections made in the April 2023 World Economic Outlook report.
Note: Projections for Afghanistan, Lebanon, Pakistan, Sri Lanka and Syria are missing from the IMF’s database. Furthermore, all figures used in the article, unless specified, are nominal GDP numbers and rates.


Markets
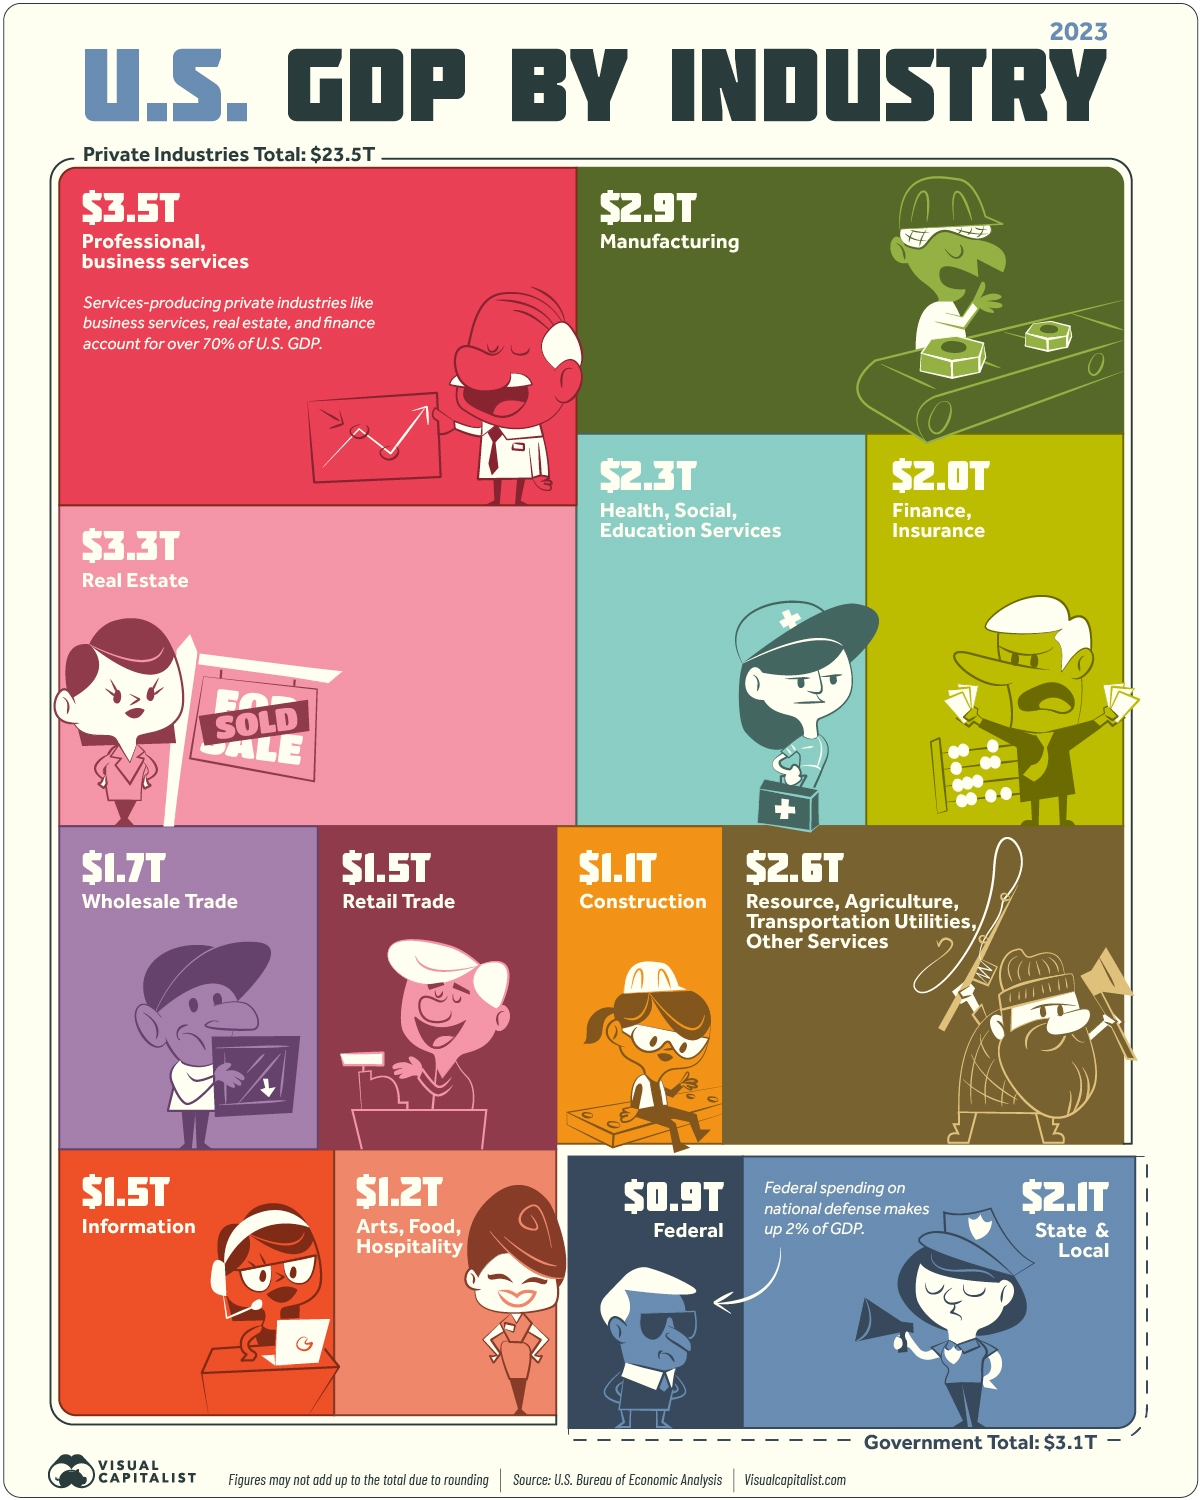
Visualizing U.S. GDP by Industry in 2023
Services-producing industries account for the majority of U.S. GDP in 2023, followed by other private industries and the government.
Visualizing U.S. GDP by Industry
The U.S. economy is like a giant machine driven by many different industries, each one akin to an essential cog that moves the whole.
Understanding the breakdown of national gross domestic product (GDP) by industry shows where commercial activity is bustling and how diverse the economy truly is.
The above infographic uses data from the Bureau of Economic Analysis to visualize a breakdown of U.S. GDP by industry in 2023. To show this, we use value added by industry, which reflects the difference between gross output and the cost of intermediate inputs.
The Top 10 U.S. Industries by GDP
As of Q1 2023, the annualized GDP of the U.S. sits at $26.5 trillion.
Of this, 88% or $23.5 trillion comes from private industries. The remaining $3 trillion is government spending at the federal, state, and local levels.
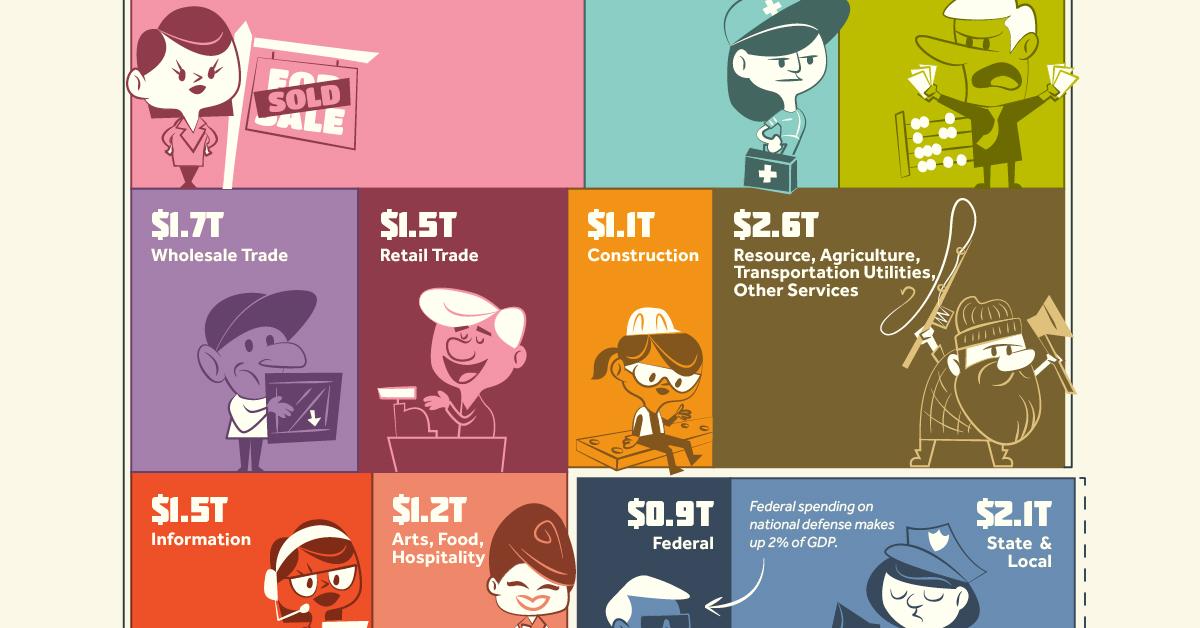
Here’s a look at the largest private industries by economic contribution in the United States:
| Industry | Annualized Nominal GDP (as of Q1 2023) | % of U.S. GDP |
|---|---|---|
| Professional and business services | $3.5T | 13% |
| Real estate, rental, and leasing | $3.3T | 12% |
| Manufacturing | $2.9T | 11% |
| Educational services, health care, and social assistance | $2.3T | 9% |
| Finance and insurance | $2.0T | 8% |
| Wholesale trade | $1.7T | 6% |
| Retail trade | $1.5T | 6% |
| Information | $1.5T | 6% |
| Arts, entertainment, recreation, accommodation, and food services | $1.2T | 4% |
| Construction | $1.1T | 4% |
| Other private industries | $2.6T | 10% |
| Total | $23.5T | 88% |
Like most other developed nations, the U.S. economy is largely based on services.
Service-based industries, including professional and business services, real estate, finance, and health care, make up the bulk (70%) of U.S. GDP. In comparison, goods-producing industries like agriculture, manufacturing, mining, and construction play a smaller role.
Professional and business services is the largest industry with $3.5 trillion in value added. It comprises establishments providing legal, consulting, design, administration, and other services. This is followed by real estate at $3.3 trillion, which has consistently been an integral part of the economy.
Due to outsourcing and other factors, the manufacturing industry’s share of GDP has been declining for decades, but it still remains a significant part of the economy. Manufacturing of durable goods (metals, machines, computers) accounts for $1.6 trillion in value added, alongside nondurable goods (food, petroleum, chemicals) at $1.3 trillion.
The Government’s Contribution to GDP
Just like private industries, the government’s value added to GDP consists of compensation of employees, taxes collected (less subsidies), and gross operating surplus.
| Government | Annualized Nominal GDP (as of Q1 2023) | % of U.S. GDP |
|---|---|---|
| State and Local | $2.1T | 8% |
| Federal | $0.9T | 4% |
| Total | $3.1T | 12% |
Figures may not add up to the total due to rounding.
State and local government spending, largely focused on the education and public welfare sectors, accounts for the bulk of value added. The Federal contribution to GDP amounts to roughly $948 billion, with 52% of it attributed to national defense.
The Fastest Growing Industries (2022–2032P)
In the next 10 years, services-producing industries are projected to see the fastest growth in output.
The table below shows the five fastest-growing industries in the U.S. from 2022–2032 in terms of total output, based on data from the Bureau of Labor Statistics:
| Industry | Sector | Compound Annual Rate of Output Growth (2022–2032P) |
|---|---|---|
| Software publishers | Information | 5.2% |
| Computing infrastructure providers, data processing, and related services | Information | 3.9% |
| Wireless telecommunications carriers (except satellite) | Information | 3.6% |
| Home health care services | Health care and social assistance | 3.6% |
| Oil and gas extraction | Mining | 3.5% |
Three of the fastest-growing industries are in the information sector, underscoring the growing role of technology and digital infrastructure. Meanwhile, the projected growth of the oil and gas extraction industry highlights the enduring demand for traditional energy sources, despite the energy transition.
Overall, the development of these industries suggests that the U.S. will continue its shift toward a services-oriented economy. But today, it’s also worth noticing how services- and goods-producing industries are increasingly tied together. For example, it’s now common for tech companies to produce devices, and for manufacturers to use software in their operations.
Therefore, the oncoming tide of growth in service-based industries could potentially lift other interconnected sectors of the diverse U.S. economy.

-

 Education1 week ago
How Hard Is It to Get Into an Ivy League School?
-

 Technology2 weeks ago
Ranked: Semiconductor Companies by Industry Revenue Share
-

 Markets2 weeks ago
Ranked: The World’s Top Flight Routes, by Revenue
-

 Demographics2 weeks ago
Population Projections: The World’s 6 Largest Countries in 2075
-

 Markets2 weeks ago
The Top 10 States by Real GDP Growth in 2023
-

 Demographics2 weeks ago
The Smallest Gender Wage Gaps in OECD Countries
-

 Economy2 weeks ago
Where U.S. Inflation Hit the Hardest in March 2024
-

 Environment2 weeks ago
Top Countries By Forest Growth Since 2001