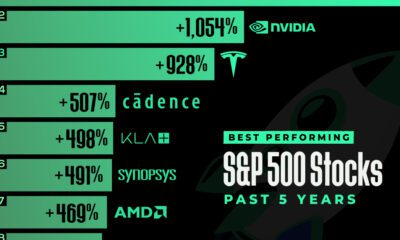

In this graphic, we've ranked the top S&P 500 stocks based on their 5-year total returns, as of November 2023.
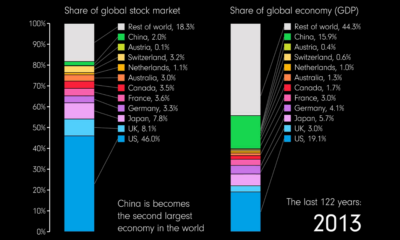

This animation compares countries' share of the global stock market and GDP over 122 years from 1900 to 2022.
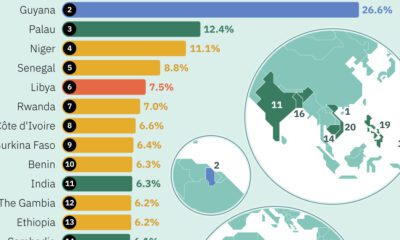

This graphic uses the latest IMF projections to rank the world's top 20 fastest growing economies for 2024.
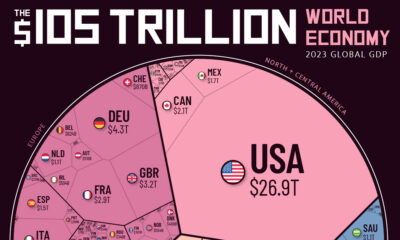

How much does each country contribute to the $105 trillion world economy in 2023, and what nations are seeing their nominal GDPs shrink?
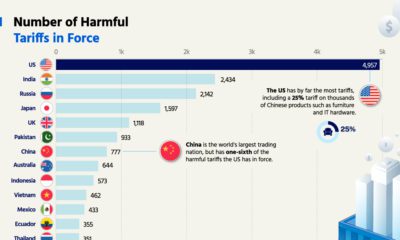

The U.S. has by far the most harmful tariffs, with nearly 5,000 in force. Which economy has the least tariffs?


How has global income distribution changed over history? Below, we show three distinct periods since the Industrial Revolution.
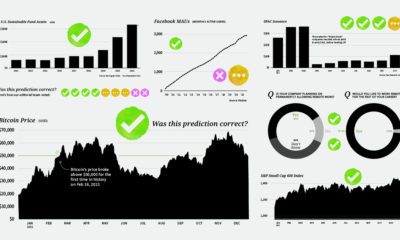

We analyze the results of predictions made by experts for 2021, to see what they got right—and what they ended up whiffing on.
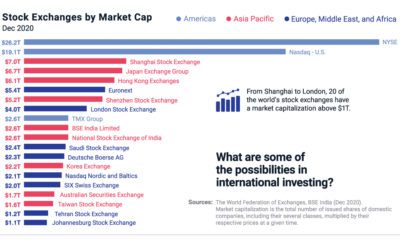

Around the world, 20 stock exchanges have a market cap above $1 trillion. Learn how international equity investing opens new possibilities.
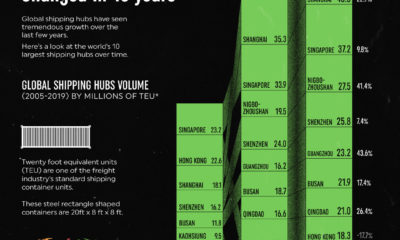

The largest shipping hubs have gotten bigger and busier. Here’s a look at how the global landscape has evolved over the past 15 years.
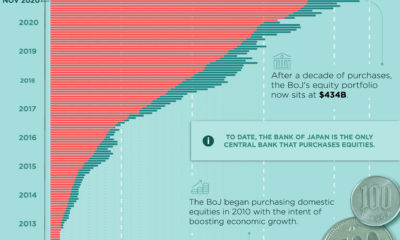

The Bank of Japan continues to be the only central bank that purchases equity securities, and it now holds $434 billion of Japanese stocks.