

Services-producing industries account for the majority of U.S. GDP in 2023, followed by other private industries and the government.

This infographic highlights the need for new gold mining projects and shows the next generation of America's gold deposits.
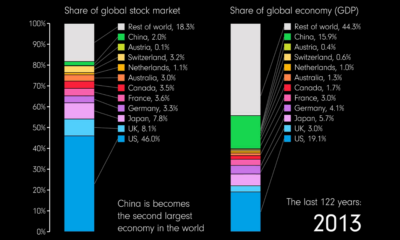

This animation compares countries' share of the global stock market and GDP over 122 years from 1900 to 2022.
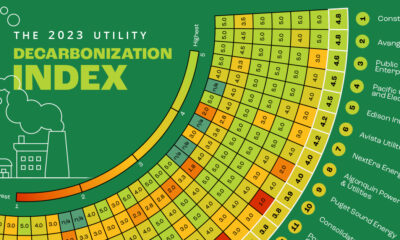

Here's a preview of the 2023 Utility Decarbonization Index, which tracks the decarbonization progress of the largest U.S. utilities.
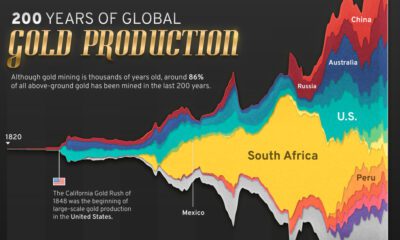

Global gold production has grown exponentially since the 1800s, with 86% of all above-ground gold mined in the last 200 years.


The world's millionaire population has more than doubled in the last decade between 2012 and 2022. We visualize these numbers here.
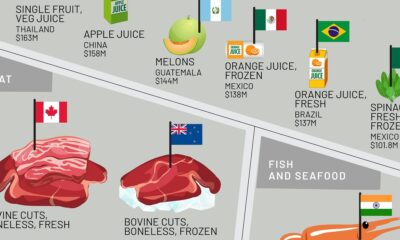

This infographic shows the top exporting countries for U.S. food imports, ranging from exotic fruits to meat, oils, spices, and more.


The oil market is bigger than the 10 largest metal markets combined, with production value exceeding $2 trillion annually.


Explore the age distribution of the 422 nuclear reactors operating globally in this infographic.
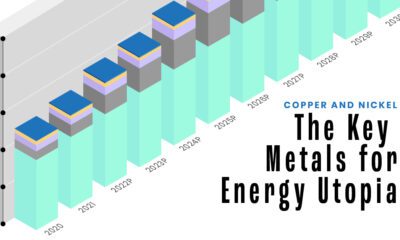

With more renewables and EVs plugging into the grid, copper and nickel are essential building blocks for the energy transition.
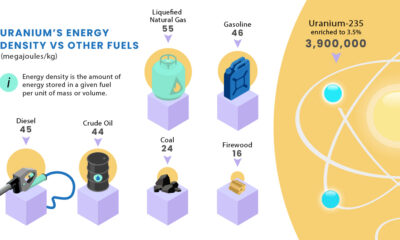

Explore how the unique features of uranium translate into advantages for nuclear power.
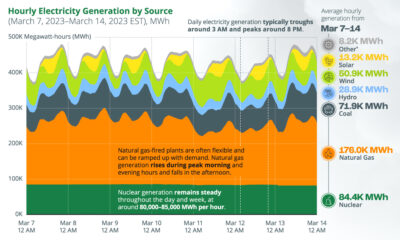

This chart tracks U.S. hourly electricity generation over one week, with various sources producing electricity at different times of the day.
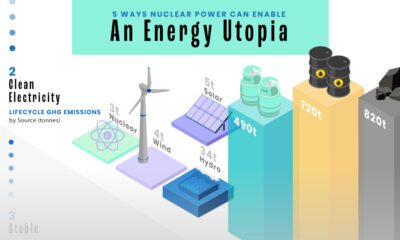

From clean electricity to high reliability, this graphic explores the five key advantages of nuclear power in the clean energy transition.


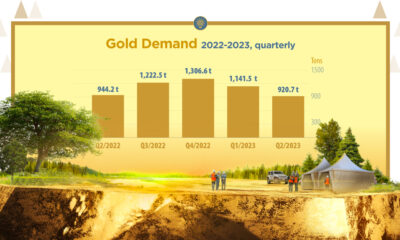
Globally, central banks bought a record 1,136 tonnes of gold in 2022. How has central bank gold demand changed over the last three decades?
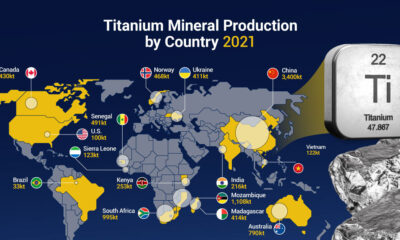

The global titanium supply chain is heavily dependent on Asian countries, including China. See where titanium comes from in this infographic.
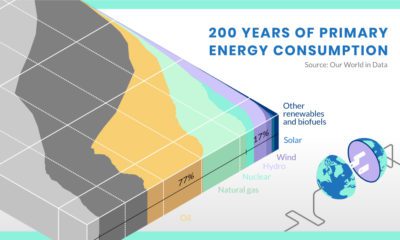

What have energy transitions looked like in the past, and what can we learn from them?


How much oil, coal, and natural gas do we extract each year? See the scale of annual fossil fuel production in perspective.


This infographic breaks down battery manufacturing capacity by country in 2022 and 2027.
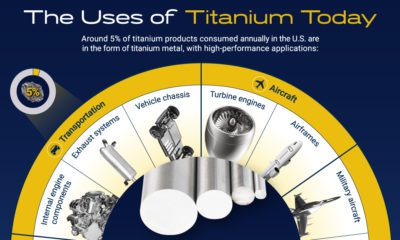

This infographic explores titanium's growth markets and potential for mainstream application.


Lithium production has grown exponentially over the last few decades. Which countries produce the most lithium, and how how has this mix evolved?
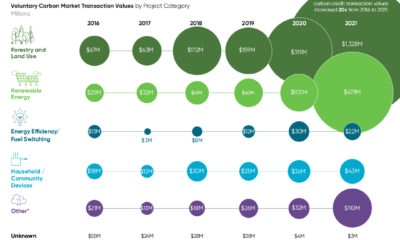

Carbon credits from nature-based solutions are in high demand as organizations look to shrink their carbon footprints.
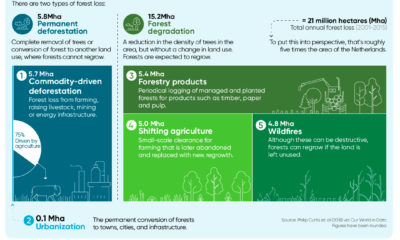

Approximately 15 billion trees are cut down annually across the world. Here's a look at the five major drivers of forest loss. (Sponsored)
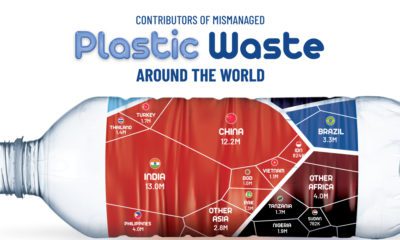

About 22% of the world's annual plastic waste generation is mismanaged. Here's a break down of mismanaged plastic waste by country.
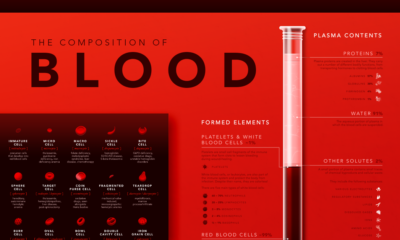

Despite its simple appearance, blood is made up of many microscopic elements. This infographic visualizes the composition of blood.

As the U.S. transitions to clean energy, investing in battery metals like lithium and cobalt can help secure an energy-independent future.
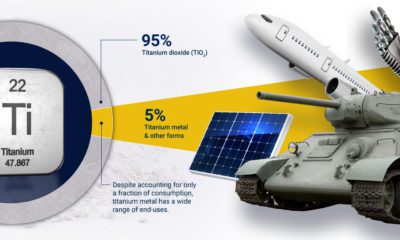

Find out everything you need to know about titanium.


See all the 2.8 billion tonnes of metals mined in 2021.
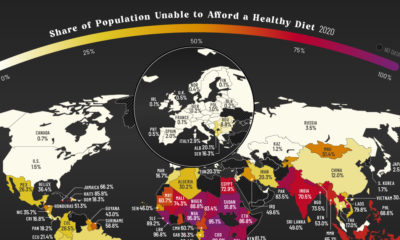

More than three billion people across the globe are unable to afford a healthy diet. See which countries are most affected.
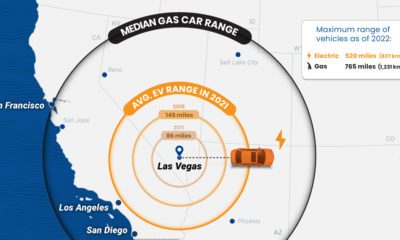

With range anxiety being a barrier to EV adoption, how far can an electric car go on one charge, and how do EV ranges compare with...
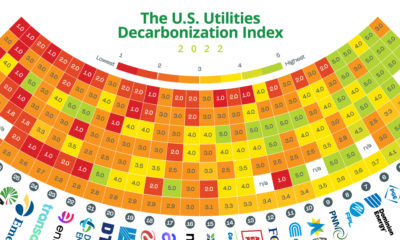

This graphic quantifies and compares the state of decarbonization among the 30 largest investor-owned utilities in the United States.
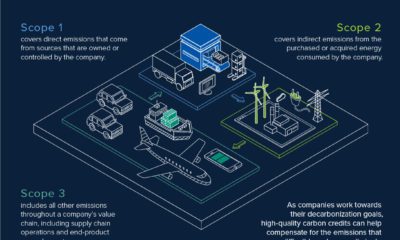

Here's a look at the 3 scopes of emissions that comprise a company's carbon footprint, according to the Greenhouse Gas Protocol. (Sponsored Content)

This infographic explores the exponential growth of the technologies that are shaping the new era of energy.
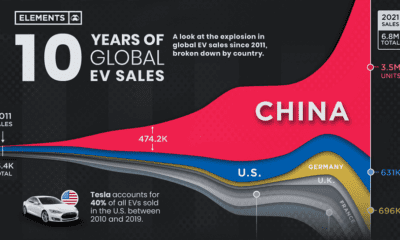

Global EV sales have grown exponentially, more than doubling in 2021 to 6.8 million units. Here's a look at EV sales by country since 2011.
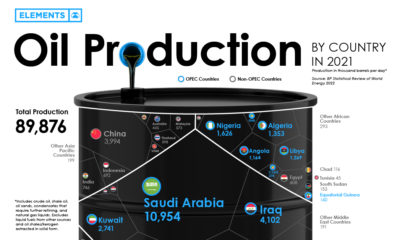

Global oil production averaged 89.8 million barrels of oil per day in 2021. Here are the world's largest oil producers.
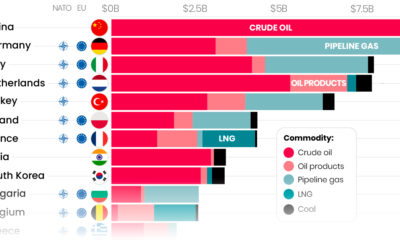

Here are the top importers of Russian fossil fuels since the start of the war.
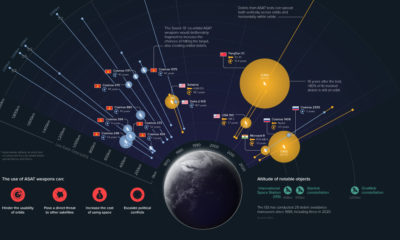

What are anti-satellite weapons, and how do they affect outer space?
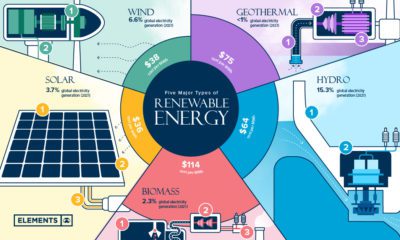

Renewable energy is the foundation of the ongoing energy transition. What are the key types of renewable energy, and how do they work?
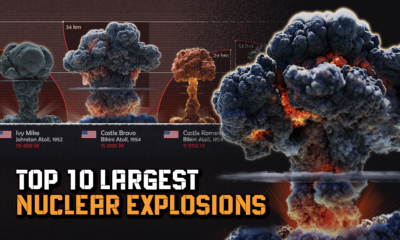

Just how powerful are nuclear bombs? Here's a look at the top 10 largest nuclear explosions.
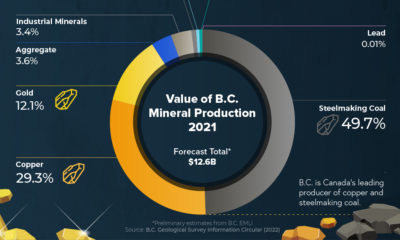

Here are 9 reasons to invest in British Columbia's mining and exploration industry.
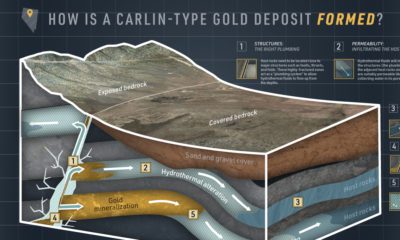

Explore everything about Carlin-type gold deposits in this infographic.
The current energy transition is unprecedented in both scale and speed. This infographic puts it into historical context.
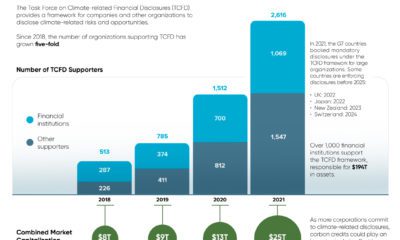

The number of organizations supporting TCFD climate disclosures has grown five-fold since 2018. (Sponsored Content)
Nuclear weapons have devastating effects, but the science of how they work is atomically small. So, how do nuclear weapons work?
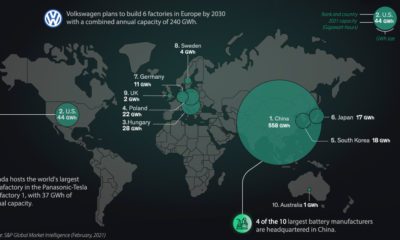

Which countries are leading the race for EV batteries?
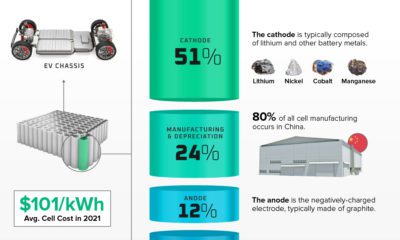

The average cost of EV batteries has fallen by 89% since 2010. What makes up the cost of a single EV battery cell?
What's the lowest-carbon way to travel? Here's how much CO2 different types of vehicles emit per passenger-kilometer.
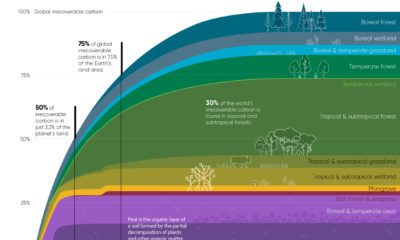

What is irrecoverable carbon, and where is it found?
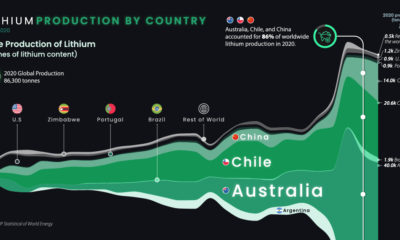

Global lithium production has more than doubled since 2016. This chart visualizes 25 years of lithium production by country.
Global energy transition investment hit $755 billion in 2021. This chart ranks the top 10 countries by energy transition investment.
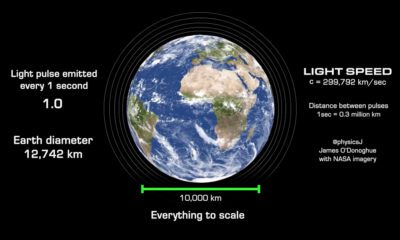

Light speed is often known as the speed limit of the universe. But in the vastness of space, even the speed of light seems slow.


 Creator Program