Markets
Animation: Stock Market vs. GDP Share, by Country (1900-2022)
Article/Editing:
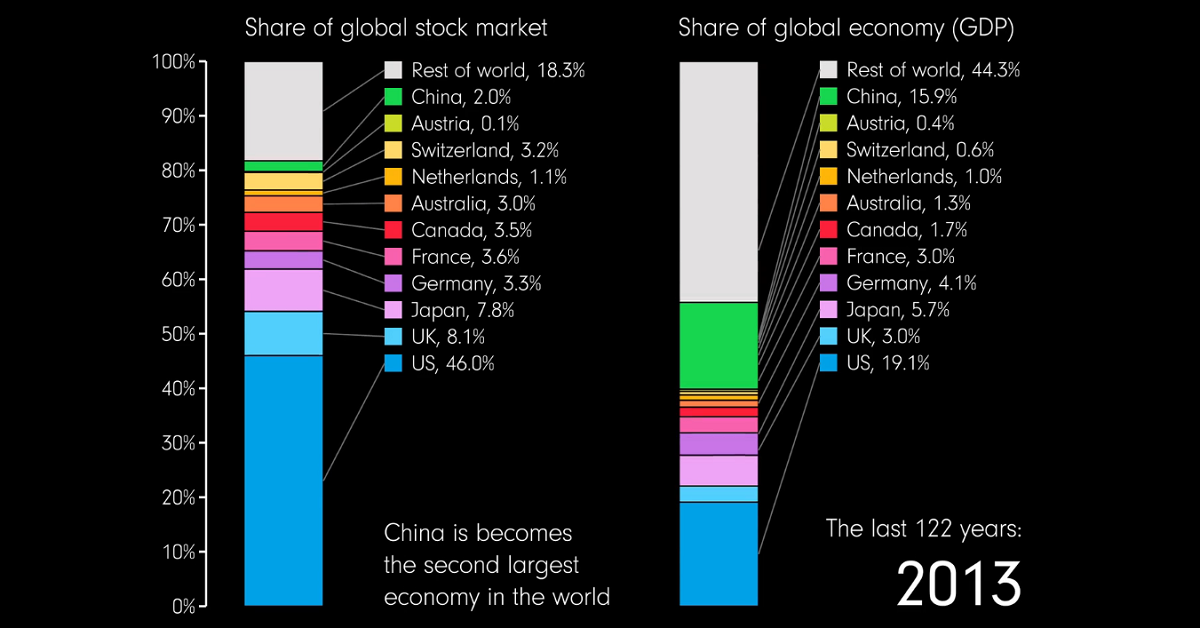
Stock Market vs. GDP Share, by Country (1900-2022)
While the distribution of global GDP has diversified over time, the global stock market remains dominated by a few developed financial markets.
In 2022, the U.S. accounted for 59% of global stock market capitalization, with a 21% share of global GDP. To put that into context, China makes up just 4% of the global stock market despite accounting for 16% of global GDP.
To explore the roots of this disconnect, this animated bar chart from James Eagle compares countries’ share of the global stock market and global GDP over 122 years from 1900 to 2022.
Understanding the Divergence: Stock Markets vs GDP
Before diving into the gap between GDP and stock market capitalization, it’s important to understand the fundamental difference between the two measures:
- GDP (Gross Domestic Product): Represents the total value of all the goods and services produced in an economy in a given year, including government spending.
- Stock Market Capitalization: Reflects the dollar value of all outstanding shares in the stock market, which are priced based on several factors including current and projected financial performance as well as economic conditions.
Essentially, changes in GDP echo the health and growth of the economy. Meanwhile, stock market valuations are more forward-looking and track how specific companies and industries are expected to deliver value to shareholders.
Besides these fundamental differences, here are two other factors that could influence the divergence between stock markets and GDP:
- Financial Market Maturity: Not all economies have equally developed or accessible financial markets. Mature financial markets like the U.S. offer a more conducive environment for businesses to access public capital.
- Economic Composition: The structure of an economy may not always mirror its stock market. For example, a country’s agricultural sector might generate a large portion of GDP, but may not be lucrative enough to be well-represented in the stock market.
Additionally, factors like a country’s political stability and regulatory environment can also influence investors’ willingness to invest in its stock markets.
With that context in mind, let’s look at how the composition of the global stock market and GDP has changed over time.
1900s: A Diverse Global Economy
In the year 1900, both the global stock market and economy were fairly diverse. The UK had the largest stock market, while the U.S. held the largest share of GDP.
| Country | Share of Global Stock Market | Share of Global GDP |
|---|---|---|
| 🇬🇧 UK | 24.2% | 9.2% |
| 🇺🇸 U.S. | 14.4% | 18.0% |
| 🇩🇪 Germany | 12.6% | 7.6% |
| 🇫🇷 France | 11.1% | 5.5% |
| 🇦🇹 Austria | 5.0% | 0.8% |
| 🇨🇳 China | 0.4% | 11.0% |
| 🌏 Other | 32.3% | 47.9% |
Meanwhile, China was the second-largest economy with 11% of the global GDP but made up just 0.4% of the worldwide stock market. At the time, China was under the rule of the Qing Dynasty, the country’s final imperial dynasty.
In 1901, the U.S. overtook the UK as the world’s largest stock market. By 1945, it was extending its dominance, accounting for nearly half of the worldwide stock market and 28% of the global GDP.
As other economies grew, America’s share of global GDP began declining, but its stock market share continued increasing and peaked at 71.6% in 1966. However, the peak was short-lived, with Japan’s economy experiencing a remarkable recovery.
1970–1990: Japan’s Economic Miracle
Following World War II, the Japanese economy shifted gears from devastation to rapid economic growth.
Driven by governmental guidance, export-focused policies, and technological innovations, Japan’s share of global GDP jumped from 3% in 1950 to over 8% in the 1980s. Simultaneously, Japan’s share of the global stock market grew from less than 1% in 1950 to 40% by 1988, briefly making it the country with the largest stock market.
However, this bubble burst in the early 1990s, leading to Japan’s “lost decade”. Since then, both the U.S. economy and stock market have been the largest in the world.
2000s: U.S. Dominance and China’s Growth
The beginning of the 21st century cemented America’s position in the global stock market, supported by the rise of tech giants like Apple, Google, and Amazon.
Simultaneously, the global economic landscape shifted with the ascent of emerging markets like China averaging annual growth rates of around 10%. By 2010, China accounted for 14% of global GDP.
However, China’s stock markets did not grow as fast, and U.S. exchanges dominated the equity markets throughout the 2000s. As of 2022, the U.S. accounted for more than half of the world’s stock market capitalization, followed from afar by Japan:
| Country | Share of Global Stock Market | Share of Global GDP |
|---|---|---|
| 🇺🇸 U.S. | 59.6% | 20.7% |
| 🇯🇵 Japan | 6.3% | 4.4% |
| 🇬🇧 UK | 3.9% | 3.1% |
| 🇨🇳 China | 3.6% | 15.8% |
| 🇫🇷 France | 2.8% | 2.9% |
| 🌏 Other | 23.8% | 53.1% |
The U.S. stock market is prevalent partly because exchanges are subject to strict regulations and offer a relatively stable business and political environment for companies. Furthermore, the U.S. is home to 31 of the 50 most valuable companies in the world, from a range of different industries.
Meanwhile, China’s stock market accounts for 3.6% of the global total, up from 0% in 2000. Despite being a relatively smaller player in the global stock market, China’s economy is massive and accounts for nearly 16% of the global GDP.
Looking Ahead
Given the fundamental differences between stock market capitalization and GDP, it’s likely that the divergence in these two measures will persist in the future.
For example, many emerging economies in Africa and Asia are projected to grow rapidly over the next few decades, likely increasing their share of the global GDP. However, their stock markets may not follow the same trajectory.
Although the U.S. faces competition from emerging financial markets, it could continue to dominate the global stock market for the foreseeable future.

This article was published as a part of Visual Capitalist's Creator Program, which features data-driven visuals from some of our favorite Creators around the world.


Economy
Economic Growth Forecasts for G7 and BRICS Countries in 2024
The IMF has released its economic growth forecasts for 2024. How do the G7 and BRICS countries compare?


G7 & BRICS Real GDP Growth Forecasts for 2024
The International Monetary Fund’s (IMF) has released its real gross domestic product (GDP) growth forecasts for 2024, and while global growth is projected to stay steady at 3.2%, various major nations are seeing declining forecasts.
This chart visualizes the 2024 real GDP growth forecasts using data from the IMF’s 2024 World Economic Outlook for G7 and BRICS member nations along with Saudi Arabia, which is still considering an invitation to join the bloc.
Get the Key Insights of the IMF’s World Economic Outlook
Want a visual breakdown of the insights from the IMF’s 2024 World Economic Outlook report?
This visual is part of a special dispatch of the key takeaways exclusively for VC+ members.
Get the full dispatch of charts by signing up to VC+.
Mixed Economic Growth Prospects for Major Nations in 2024
Economic growth projections by the IMF for major nations are mixed, with the majority of G7 and BRICS countries forecasted to have slower growth in 2024 compared to 2023.
Only three BRICS-invited or member countries, Saudi Arabia, the UAE, and South Africa, have higher projected real GDP growth rates in 2024 than last year.
| Group | Country | Real GDP Growth (2023) | Real GDP Growth (2024P) |
|---|---|---|---|
| G7 | 🇺🇸 U.S. | 2.5% | 2.7% |
| G7 | 🇨🇦 Canada | 1.1% | 1.2% |
| G7 | 🇯🇵 Japan | 1.9% | 0.9% |
| G7 | 🇫🇷 France | 0.9% | 0.7% |
| G7 | 🇮🇹 Italy | 0.9% | 0.7% |
| G7 | 🇬🇧 UK | 0.1% | 0.5% |
| G7 | 🇩🇪 Germany | -0.3% | 0.2% |
| BRICS | 🇮🇳 India | 7.8% | 6.8% |
| BRICS | 🇨🇳 China | 5.2% | 4.6% |
| BRICS | 🇦🇪 UAE | 3.4% | 3.5% |
| BRICS | 🇮🇷 Iran | 4.7% | 3.3% |
| BRICS | 🇷🇺 Russia | 3.6% | 3.2% |
| BRICS | 🇪🇬 Egypt | 3.8% | 3.0% |
| BRICS-invited | 🇸🇦 Saudi Arabia | -0.8% | 2.6% |
| BRICS | 🇧🇷 Brazil | 2.9% | 2.2% |
| BRICS | 🇿🇦 South Africa | 0.6% | 0.9% |
| BRICS | 🇪🇹 Ethiopia | 7.2% | 6.2% |
| 🌍 World | 3.2% | 3.2% |
China and India are forecasted to maintain relatively high growth rates in 2024 at 4.6% and 6.8% respectively, but compared to the previous year, China is growing 0.6 percentage points slower while India is an entire percentage point slower.
On the other hand, four G7 nations are set to grow faster than last year, which includes Germany making its comeback from its negative real GDP growth of -0.3% in 2023.
Faster Growth for BRICS than G7 Nations
Despite mostly lower growth forecasts in 2024 compared to 2023, BRICS nations still have a significantly higher average growth forecast at 3.6% compared to the G7 average of 1%.
While the G7 countries’ combined GDP is around $15 trillion greater than the BRICS nations, with continued higher growth rates and the potential to add more members, BRICS looks likely to overtake the G7 in economic size within two decades.
BRICS Expansion Stutters Before October 2024 Summit
BRICS’ recent expansion has stuttered slightly, as Argentina’s newly-elected president Javier Milei declined its invitation and Saudi Arabia clarified that the country is still considering its invitation and has not joined BRICS yet.
Even with these initial growing pains, South Africa’s Foreign Minister Naledi Pandor told reporters in February that 34 different countries have submitted applications to join the growing BRICS bloc.
Any changes to the group are likely to be announced leading up to or at the 2024 BRICS summit which takes place October 22-24 in Kazan, Russia.
Get the Full Analysis of the IMF’s Outlook on VC+
This visual is part of an exclusive special dispatch for VC+ members which breaks down the key takeaways from the IMF’s 2024 World Economic Outlook.
For the full set of charts and analysis, sign up for VC+.

-

 Education1 week ago
How Hard Is It to Get Into an Ivy League School?
-

 Technology2 weeks ago
Ranked: Semiconductor Companies by Industry Revenue Share
-

 Markets2 weeks ago
Ranked: The World’s Top Flight Routes, by Revenue
-

 Demographics2 weeks ago
Population Projections: The World’s 6 Largest Countries in 2075
-

 Markets2 weeks ago
The Top 10 States by Real GDP Growth in 2023
-

 Demographics2 weeks ago
The Smallest Gender Wage Gaps in OECD Countries
-

 Economy2 weeks ago
Where U.S. Inflation Hit the Hardest in March 2024
-

 Green2 weeks ago
Top Countries By Forest Growth Since 2001