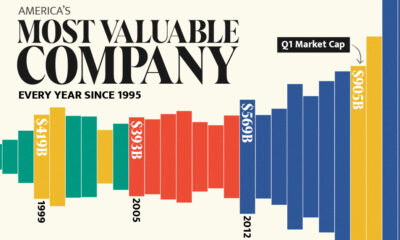

Over the last three decades, the growth of tech companies has driven a shift in the ranking of the most valuable companies in the U.S.
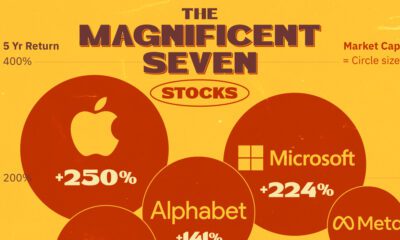

FAANG is dead… meet the 'Magnificent Seven' stocks that now make up over 25% of the S&P 500.
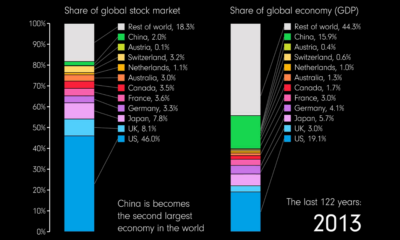

This animation compares countries' share of the global stock market and GDP over 122 years from 1900 to 2022.
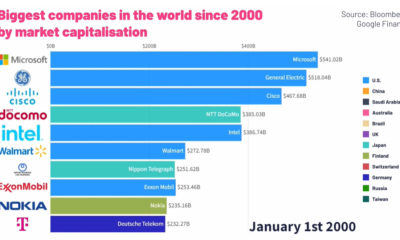

This animated graphic provides a breakdown of the world’s top ten largest public companies from 2000 to 2022.
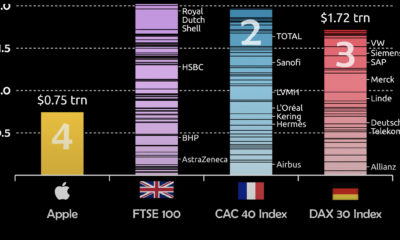

Apple's market cap recently hit $3 trillion. To put that scale into context, this visualization compares Apple to European indexes.
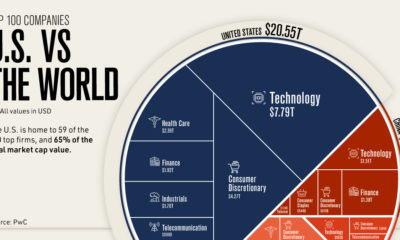

Where are the top 100 companies of the world located? We highlight the U.S. share of the top companies by market capitalization .
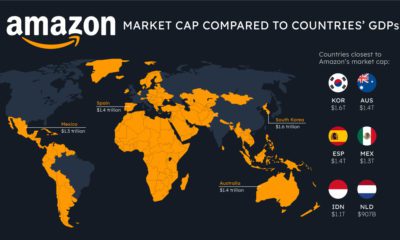

How do the big tech giants compare to entire countries? Here's how Apple, Microsoft, and Amazon's market caps stack up against national GDP.
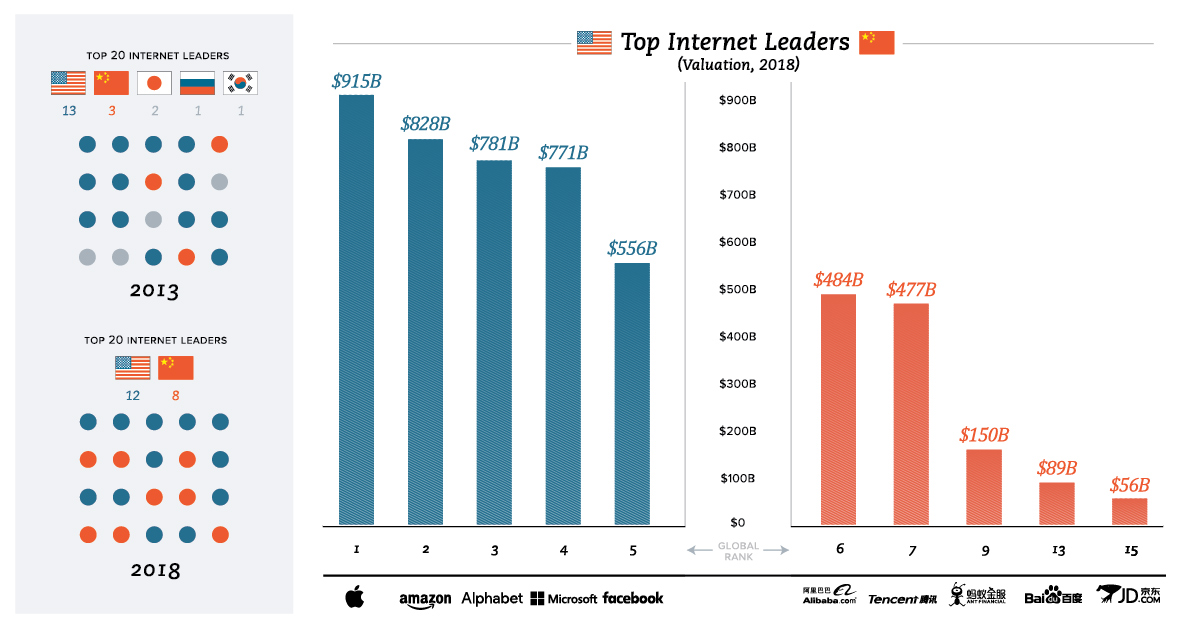
A total of 12 of the largest tech giants come from the United States, while eight hail from China. All other countries combine for zero.
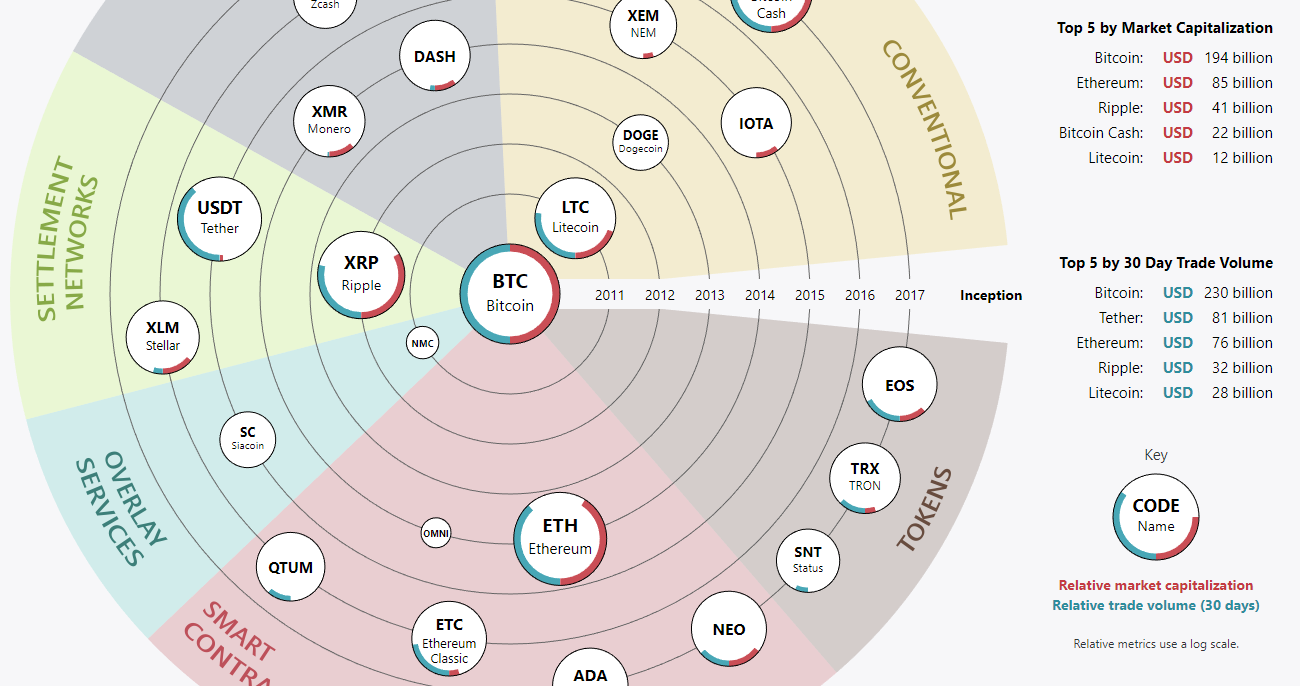
Bitcoin is in the mainstream spotlight, but there's also a lot happening behind the scenes. Here's a comparison of the 25 most notable cryptocurrencies.
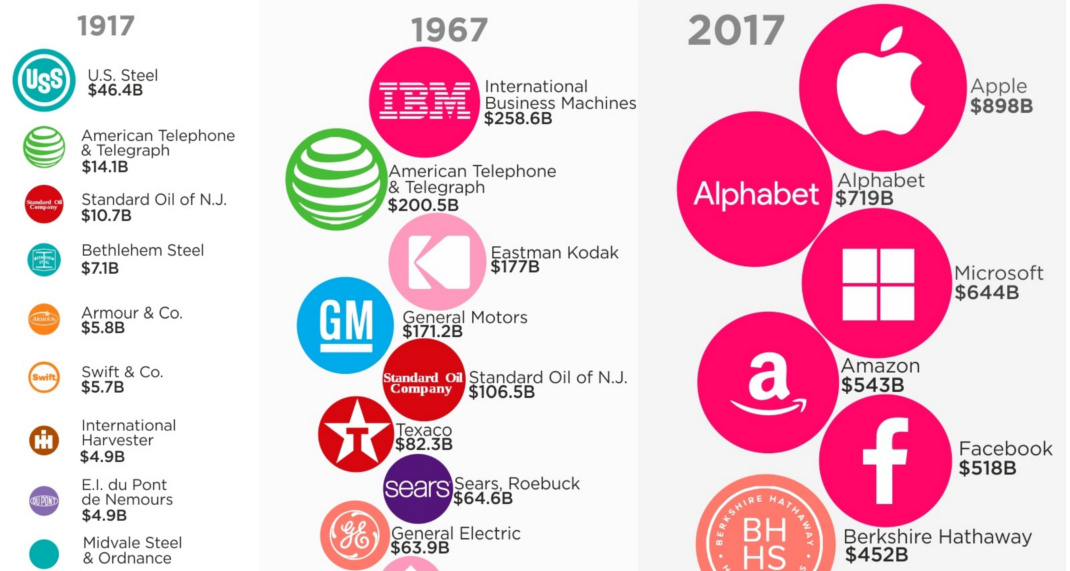
How have the most valuable companies in the U.S. changed over the last century? Today's graphic shows the evolution from U.S. Steel to Apple.


 Creator Program