Chart of the Week
Visualizing The World’s 20 Largest Tech Giants
Visualizing The World’s 20 Largest Tech Giants
The Chart of the Week is a weekly Visual Capitalist feature on Fridays.
Large companies can be located all over the globe.
For example, massive auto companies can be found practically anywhere on a map. Ford (USA), Toyota (Japan), Volkswagen (Germany), Hyundai (South Korea), Volvo (Sweden), Tata Motors (India), and Magna (Canada) are just some of the biggest companies involved in the production of vehicles or parts.
While the banking, pharma, energy, and retail industries also have geographic spread as well, the same cannot be said for the rapidly-growing tech industry.
The Clash of Tech Titans
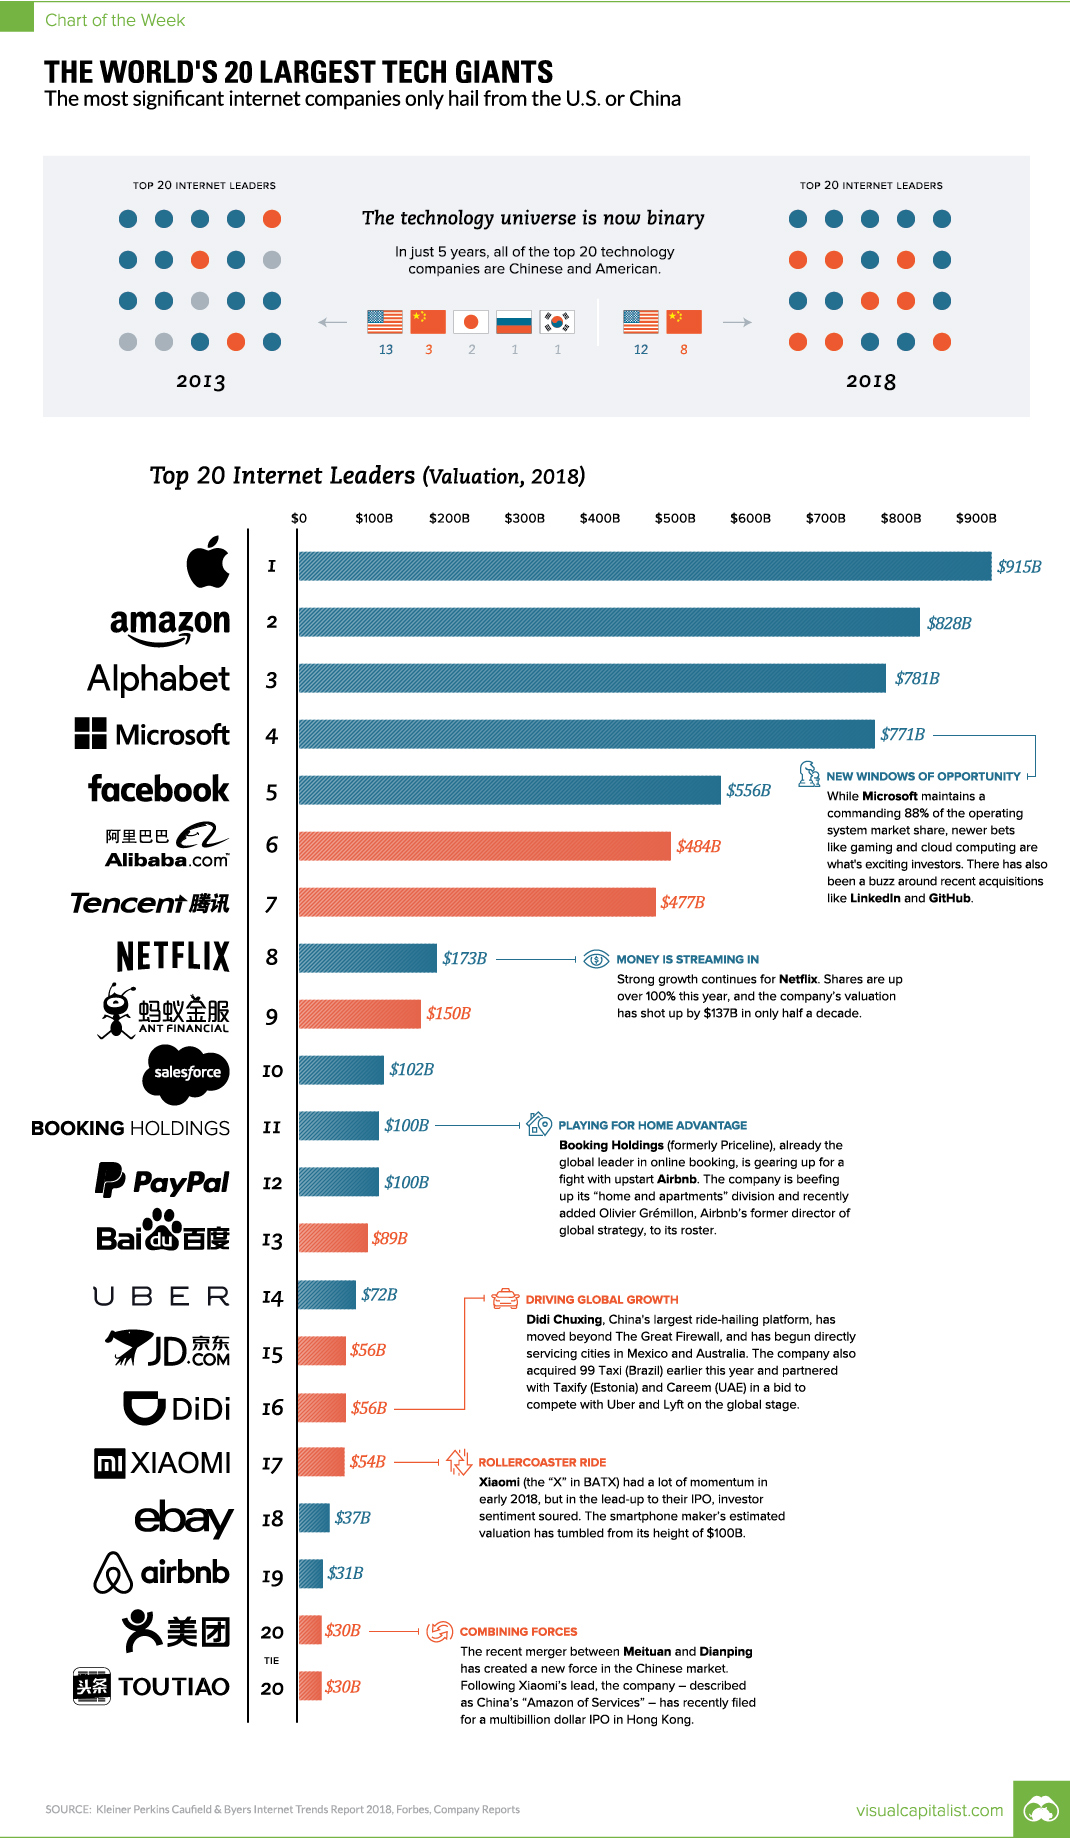
The most recent edition of Mary Meeker’s famous Internet Trends 2018 report highlighted the top internet companies in the world by valuation, with an interesting and perhaps unintended outcome.
Of the 20 largest tech giants globally, a total of zero are located outside of the United States and China.
Here are the latest rankings of internet companies, using updated market caps for all public companies:
| Rank | Company | Valuation ($B) | Type | Country |
|---|---|---|---|---|
| #1 | Apple | $915 | Public | USA |
| #2 | Amazon | $828 | Public | USA |
| #3 | Alphabet | $781 | Public | USA |
| #4 | Microsoft | $771 | Public | USA |
| #5 | $556 | Public | USA | |
| #6 | Alibaba | $484 | Public | China |
| #7 | Tencent | $477 | Public | China |
| #8 | Netflix | $173 | Public | USA |
| #9 | Ant Financial | $150 | Private | China |
| #10 | Salesforce | $102 | Public | USA |
| #11 | Booking Holdings | $100 | Public | USA |
| #12 | Paypal* | $100 | Public | USA |
| #13 | Baidu | $89 | Public | China |
| #14 | Uber | $72 | Private | USA |
| #15 | JD.com | $56 | Public | China |
| #16 | Didi Chuxing | $56 | Private | China |
| #17 | Xiaomi | $54 | Private** | China |
| #18 | eBay* | $37 | Public | USA |
| #19 | Airbnb | $31 | Private | USA |
| #20 | Meituan-Dianping | $30 | Private | China |
| #21 | Toutiao | $30 | Private | China |
*In Meeker’s chart, she kept eBay-Paypal together as one entity. We’ve separated them based on the 2015 spinoff.
**Xiaomi’s valuation has been in question ahead of its July 9 IPO in Hong Kong, and we’ve used the most recent valuation estimate of $54 billion here.
In total, the above list of companies is worth $5.9 trillion, with a 75%-25% split in terms of USA/China.
It’s also worth noting that the list excludes Samsung, likely because the South Korean company is quite diversified in its manufacturing activities (TVs, refrigerators, air conditioners, batteries, microwave ovens, etc.).
A Steep Dropoff
Aside from the USA-China duality, the other major noticeable aspect of the list of the world’s largest tech giants is that it clearly shows a divide between top-tier companies and those further down the ladder. In fact, there is not a single company with a valuation between $200 billion and $450 billion.
The top seven companies on the list account for 81% of the total value of the list, and they are all above the $450B mark. These include behemoths like Apple, Alphabet, Amazon and Microsoft, but also two big Chinese companies as well (Tencent, Alibaba).
Meanwhile, the bottom 14 companies muster up just 19% of the value – a fact that underlines how hard it is to vault a tech company into the upper echelon of the market.
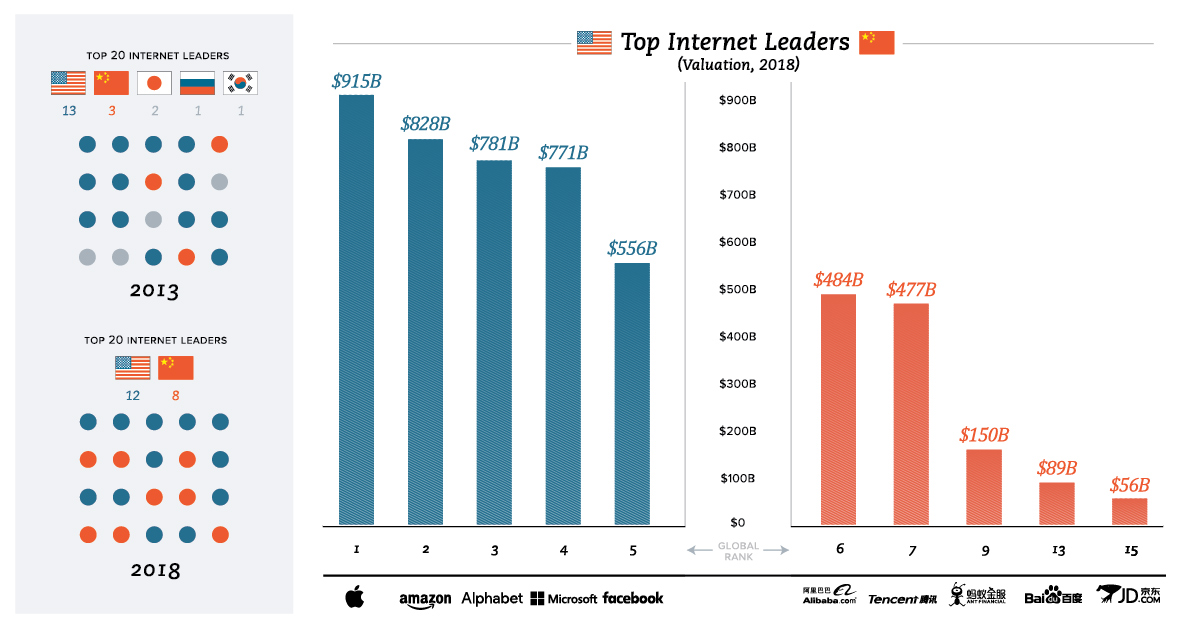


Chart of the Week
The Road to Recovery: Which Economies are Reopening?
We look at mobility rates as well as COVID-19 recovery rates for 41 economies, to see which countries are reopening for business.

The Road to Recovery: Which Economies are Reopening?
COVID-19 has brought the world to a halt—but after months of uncertainty, it seems that the situation is slowly taking a turn for the better.
Today’s chart measures the extent to which 41 major economies are reopening, by plotting two metrics for each country: the mobility rate and the COVID-19 recovery rate:
- Mobility Index
This refers to the change in activity around workplaces, subtracting activity around residences, measured as a percentage deviation from the baseline. - COVID-19 Recovery Rate
The number of recovered cases in a country is measured as the percentage of total cases.
Data for the first measure comes from Google’s COVID-19 Community Mobility Reports, which relies on aggregated, anonymous location history data from individuals. Note that China does not show up in the graphic as the government bans Google services.
COVID-19 recovery rates rely on values from CoronaTracker, using aggregated information from multiple global and governmental databases such as WHO and CDC.
Reopening Economies, One Step at a Time
In general, the higher the mobility rate, the more economic activity this signifies. In most cases, mobility rate also correlates with a higher rate of recovered people in the population.
Here’s how these countries fare based on the above metrics.
| Country | Mobility Rate | Recovery Rate | Total Cases | Total Recovered |
|---|---|---|---|---|
| Argentina | -56% | 31.40% | 14,702 | 4,617 |
| Australia | -41% | 92.03% | 7,150 | 6,580 |
| Austria | -100% | 91.93% | 16,628 | 15,286 |
| Belgium | -105% | 26.92% | 57,849 | 15,572 |
| Brazil | -48% | 44.02% | 438,812 | 193,181 |
| Canada | -67% | 52.91% | 88,512 | 46,831 |
| Chile | -110% | 41.58% | 86,943 | 36,150 |
| Colombia | -73% | 26.28% | 25,366 | 6,665 |
| Czechia | -29% | 70.68% | 9,140 | 6,460 |
| Denmark | -93% | 88.43% | 11,512 | 10,180 |
| Finland | -93% | 81.57% | 6,743 | 5,500 |
| France | -100% | 36.08% | 186,238 | 67,191 |
| Germany | -99% | 89.45% | 182,452 | 163,200 |
| Greece | -32% | 47.28% | 2,906 | 1,374 |
| Hong Kong | -10% | 97.00% | 1,067 | 1,035 |
| Hungary | -49% | 52.31% | 3,816 | 1,996 |
| India | -65% | 42.88% | 165,386 | 70,920 |
| Indonesia | -77% | 25.43% | 24,538 | 6,240 |
| Ireland | -79% | 88.92% | 24,841 | 22,089 |
| Israel | -31% | 87.00% | 16,872 | 14,679 |
| Italy | -52% | 64.99% | 231,732 | 150,604 |
| Japan | -33% | 84.80% | 16,683 | 14,147 |
| Malaysia | -53% | 80.86% | 7,629 | 6,169 |
| Mexico | -69% | 69.70% | 78,023 | 54,383 |
| Netherlands | -97% | 0.01% | 45,950 | 3 |
| New Zealand | -21% | 98.01% | 1,504 | 1,474 |
| Norway | -100% | 91.87% | 8,411 | 7,727 |
| Philippines | -87% | 23.08% | 15,588 | 3,598 |
| Poland | -36% | 46.27% | 22,825 | 10,560 |
| Portugal | -65% | 58.99% | 31,596 | 18,637 |
| Singapore | -105% | 55.02% | 33,249 | 18,294 |
| South Africa | -74% | 52.44% | 27,403 | 14,370 |
| South Korea | -4% | 91.15% | 11,344 | 10,340 |
| Spain | -67% | 69.11% | 284,986 | 196,958 |
| Sweden | -93% | 13.91% | 35,727 | 4,971 |
| Switzerland | -101% | 91.90% | 30,796 | 28,300 |
| Taiwan | 4% | 95.24% | 441 | 420 |
| Thailand | -36% | 96.08% | 3,065 | 2,945 |
| U.S. | -56% | 28.20% | 1,768,346 | 498,720 |
| United Kingdom | -82% | 0.05% | 269,127 | 135 |
| Vietnam | 15% | 85.02% | 327 | 278 |
Mobility data as of May 21, 2020 (Latest available). COVID-19 case data as of May 29, 2020.
In the main scatterplot visualization, we’ve taken things a step further, assigning these countries into four distinct quadrants:
1. High Mobility, High Recovery
High recovery rates are resulting in lifted restrictions for countries in this quadrant, and people are steadily returning to work.
New Zealand has earned praise for its early and effective pandemic response, allowing it to curtail the total number of cases. This has resulted in a 98% recovery rate, the highest of all countries. After almost 50 days of lockdown, the government is recommending a flexible four-day work week to boost the economy back up.
2. High Mobility, Low Recovery
Despite low COVID-19 related recoveries, mobility rates of countries in this quadrant remain higher than average. Some countries have loosened lockdown measures, while others did not have strict measures in place to begin with.
Brazil is an interesting case study to consider here. After deferring lockdown decisions to state and local levels, the country is now averaging the highest number of daily cases out of any country. On May 28th, for example, the country had 24,151 new cases and 1,067 new deaths.
3. Low Mobility, High Recovery
Countries in this quadrant are playing it safe, and holding off on reopening their economies until the population has fully recovered.
Italy, the once-epicenter for the crisis in Europe is understandably wary of cases rising back up to critical levels. As a result, it has opted to keep its activity to a minimum to try and boost the 65% recovery rate, even as it slowly emerges from over 10 weeks of lockdown.
4. Low Mobility, Low Recovery
Last but not least, people in these countries are cautiously remaining indoors as their governments continue to work on crisis response.
With a low 0.05% recovery rate, the United Kingdom has no immediate plans to reopen. A two-week lag time in reporting discharged patients from NHS services may also be contributing to this low number. Although new cases are leveling off, the country has the highest coronavirus-caused death toll across Europe.
The U.S. also sits in this quadrant with over 1.7 million cases and counting. Recently, some states have opted to ease restrictions on social and business activity, which could potentially result in case numbers climbing back up.
Over in Sweden, a controversial herd immunity strategy meant that the country continued business as usual amid the rest of Europe’s heightened regulations. Sweden’s COVID-19 recovery rate sits at only 13.9%, and the country’s -93% mobility rate implies that people have been taking their own precautions.
COVID-19’s Impact on the Future
It’s important to note that a “second wave” of new cases could upend plans to reopen economies. As countries reckon with these competing risks of health and economic activity, there is no clear answer around the right path to take.
COVID-19 is a catalyst for an entirely different future, but interestingly, it’s one that has been in the works for a while.
Without being melodramatic, COVID-19 is like the last nail in the coffin of globalization…The 2008-2009 crisis gave globalization a big hit, as did Brexit, as did the U.S.-China trade war, but COVID is taking it to a new level.
—Carmen Reinhart, incoming Chief Economist for the World Bank
Will there be any chance of returning to “normal” as we know it?

-

 Education1 week ago
How Hard Is It to Get Into an Ivy League School?
-

 Technology2 weeks ago
Ranked: Semiconductor Companies by Industry Revenue Share
-

 Markets2 weeks ago
Ranked: The World’s Top Flight Routes, by Revenue
-

 Demographics2 weeks ago
Population Projections: The World’s 6 Largest Countries in 2075
-

 Markets2 weeks ago
The Top 10 States by Real GDP Growth in 2023
-

 Demographics2 weeks ago
The Smallest Gender Wage Gaps in OECD Countries
-

 Economy2 weeks ago
Where U.S. Inflation Hit the Hardest in March 2024
-

 Green2 weeks ago
Top Countries By Forest Growth Since 2001