

The world's millionaire population has more than doubled in the last decade between 2012 and 2022. We visualize these numbers here.

10 million hectares of forests are lost every year. What are the knock-on effects of such drastic tropical deforestation?
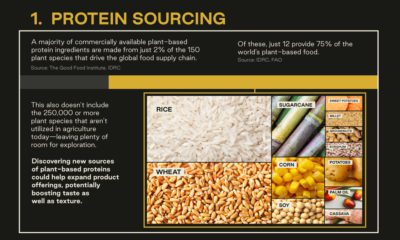

With the booming popularity of plant-based food, here are five innovative opportunities to reshape the industry and meet the meatless demand.
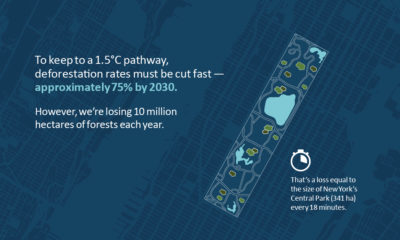

Tropical deforestation is a culprit of carbon emissions—which makes protecting forests crucial to keep to the Paris Agreement 1.5°C pathway.
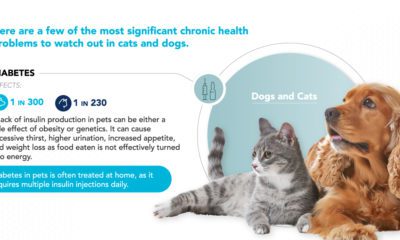

The global pet health care market is set to surpass $350 billion by 2027. Which chronic illnesses are most prevalent in pets?
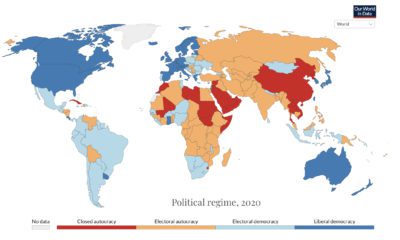

Only 93 countries enjoy a basic level of democratic rights as of 2020. Find out how this has changed in 200 years.
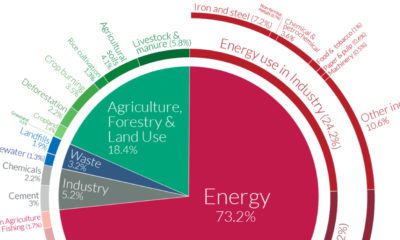

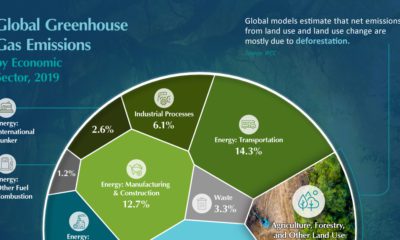
A Global Breakdown of Greenhouse Gas Emissions by Sector In a few decades, greenhouse gases (GHGs)—chiefly in the form of CO₂ emissions—have risen at unprecedented rates...
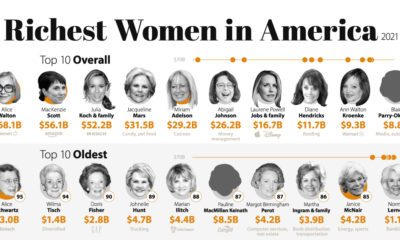

Only 12% of billionaires in the U.S. are women. Who is part of this prestigious group of the richest women in America?
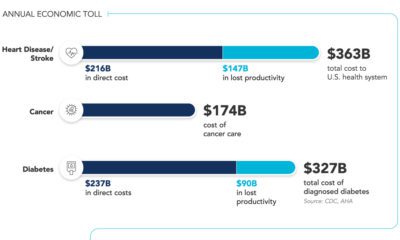

6 in 10 U.S. adults live with at least one chronic disease. What are the high costs of chronic diseases, and the challenges of treating them?
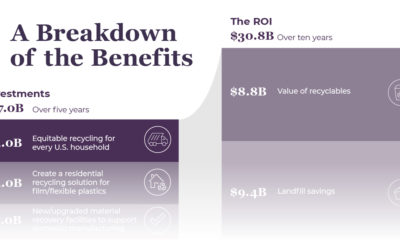

Nearly 40 million U.S. households have little to no access to recycling. Why is now the opportune time to fix recycling in America?
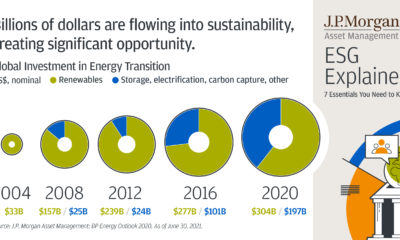

Want to invest in ESG, but not sure where to start? Begin with these 7 ESG essentials every investor should know.
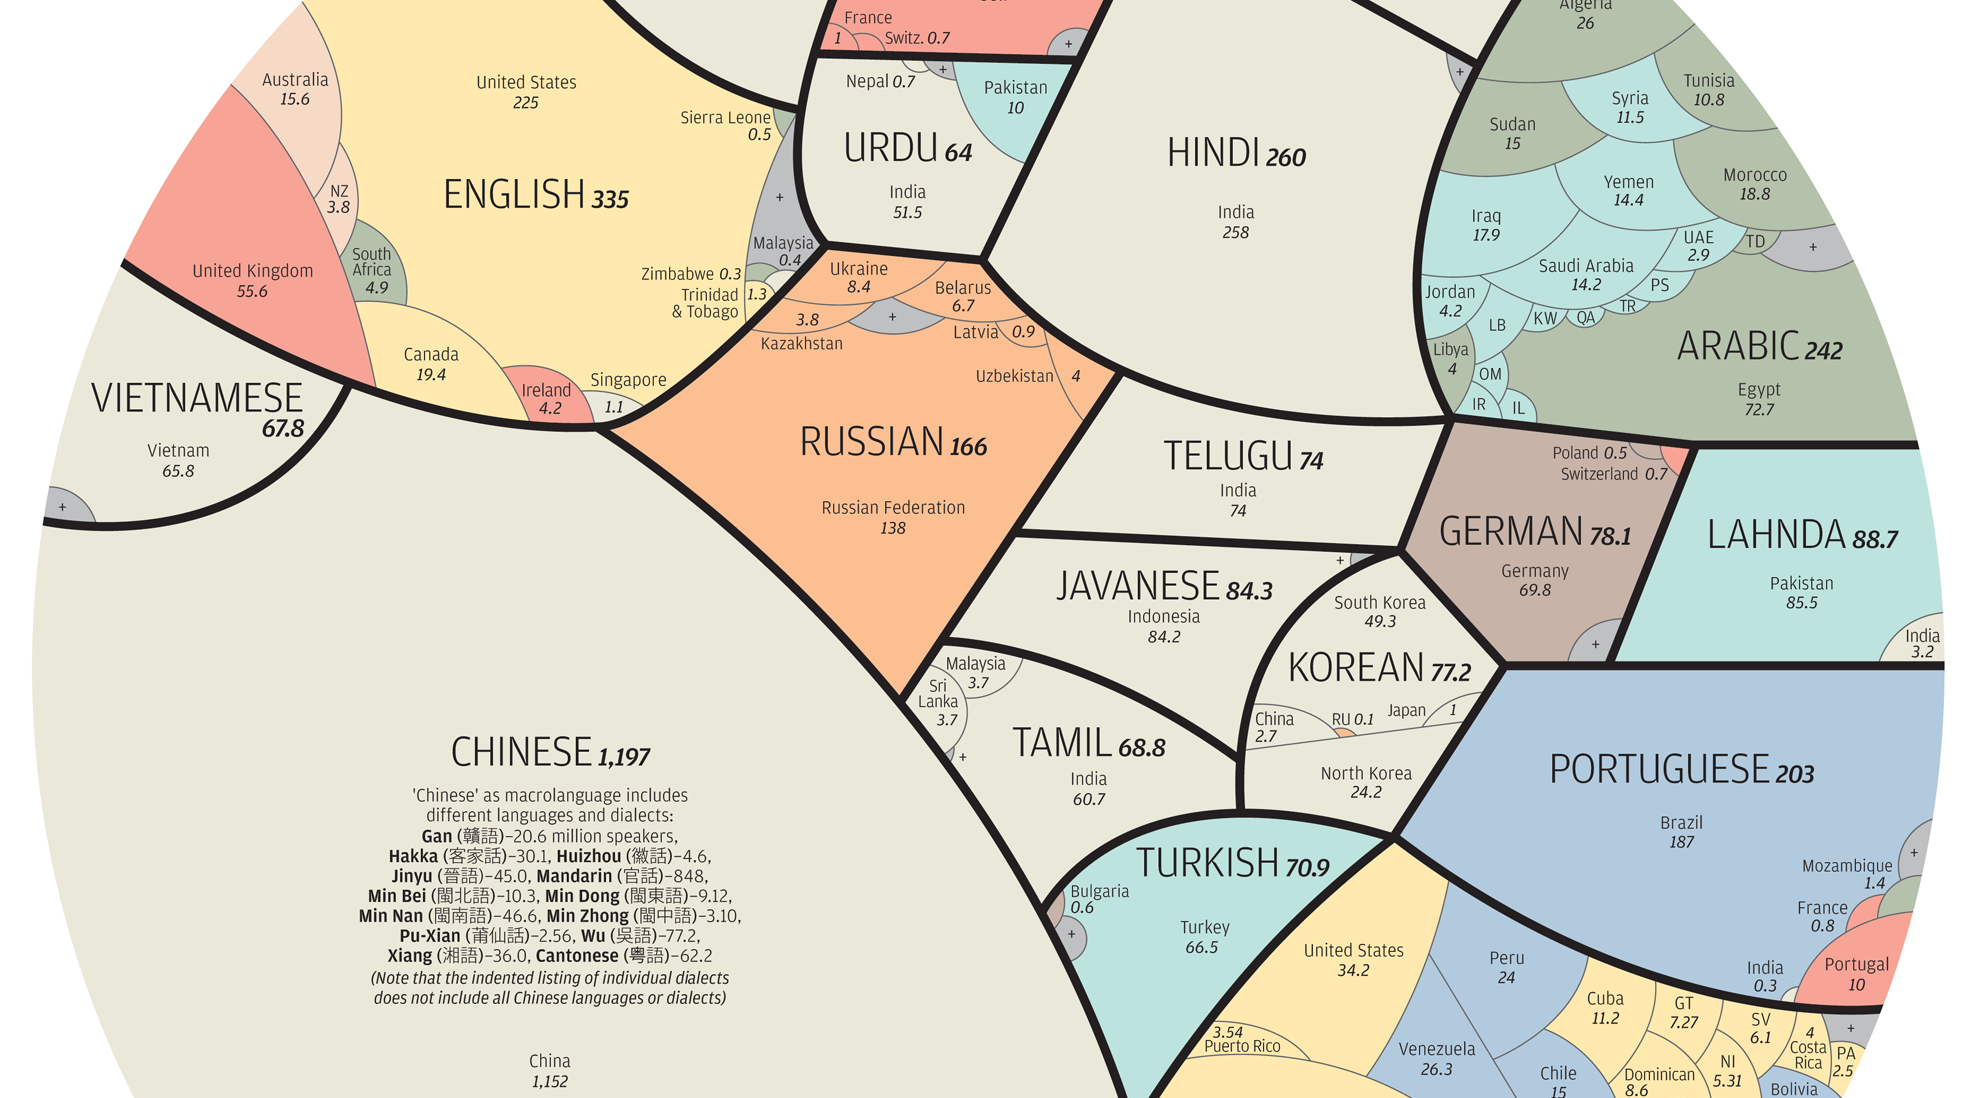
See the world's major languages broken down by country in this stunning visualization.
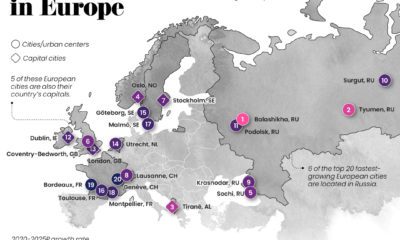

By 2050, nearly 84% of Europe will live in urban areas. Which fastest growing cities in Europe are leading the way between 2020-2025?
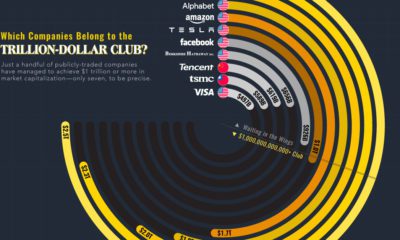

Only a few companies have broken the 13-digit market cap barrier to join the $1T+ club. Who's a member, and who’s hot on their heels?


Our planet supports nearly 8.7 million species. We break down the total composition of the living world in terms of its biomass.
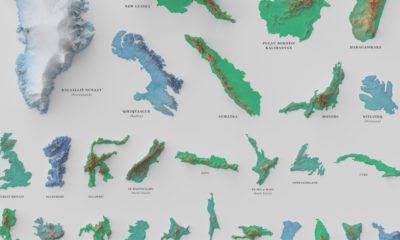

See the world's 100 biggest islands in a side-by-side comparison. Then, we look to see which islands have the highest population densities.
For Olympic athletes that place on the podium, some can expect a handsome medal bonus from their home countries—up to six figures' worth.
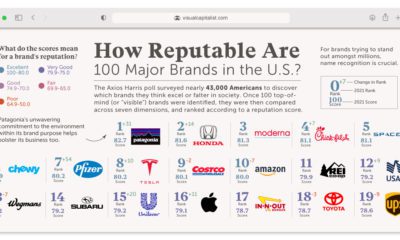

What comes to mind when you think of a good or bad brand? This poll ranks the brand reputation of 100 major companies in America.
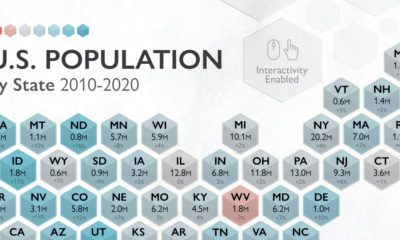

The U.S. saw 7.4% population growth in the past decade, the lowest it's been since the 1930s. How does population by state look today?
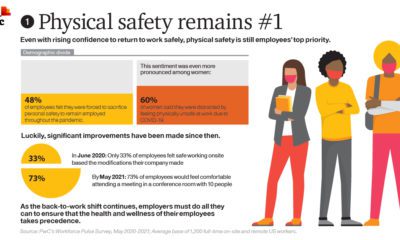

The pandemic has put the workforce through the wringer. This year-long survey highlights the four biggest back-to-work priorities and challenges that must be addressed.


There are over 18 million living veterans in the U.S., but how many are ultra wealthy? This visual ranks the richest veterans in America.
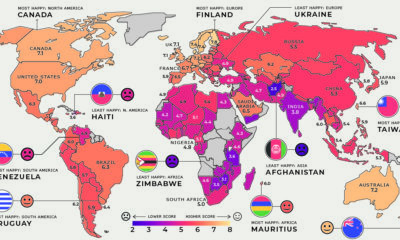

Global happiness levels are determined by many diverse factors. These maps look at the happiest and unhappiest countries in every region.
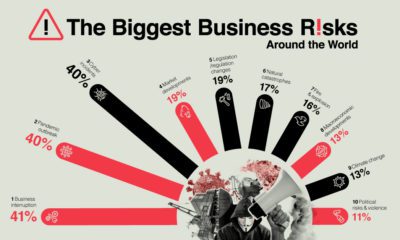

We live in an increasingly volatile world, where change is the only constant. Which are the top ten business risks to watch out for?
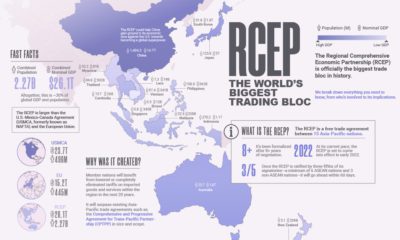

The Regional Comprehensive Economic Partnership (RCEP) covers 30% of global GDP and population. Here's everything you need to know about it.
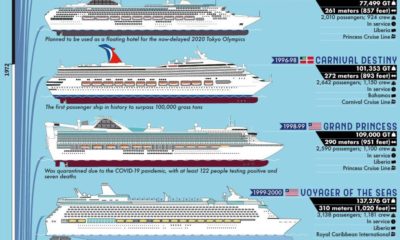

This giant infographic explores the biggest passenger ships on the open seas, over a period of almost 200 years.
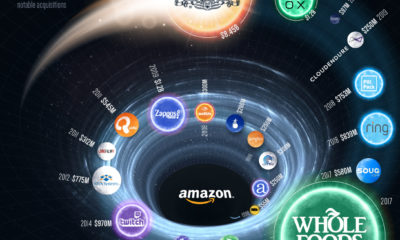

Amazon just announced its plan to acquire MGM Studios—one of the tech giant’s largest acquisitions to date.
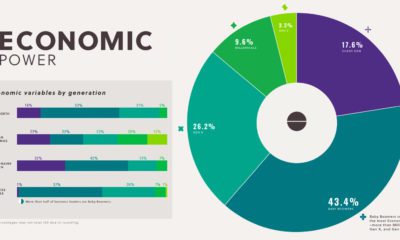

Baby Boomers hold more economic power than Gen X, Millennials, and Gen Z together. See how it all breaks down.
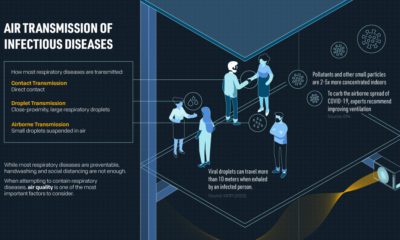

Proper indoor air quality prevents airborne viruses like COVID-19 from spreading, and require technical solutions so businesses run smoothly.
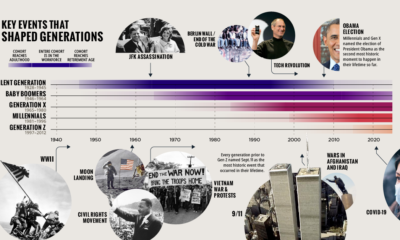

This timeline, from our Generational Power Index report, explores defining events in U.S. history that impacted each generation.
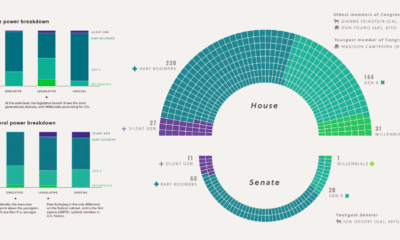

Visual Capitalist's inaugural Generational Power Index (GPI) examines the political power held by each generation and their influence on society.
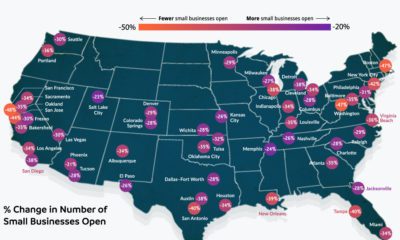

Compared to January 2020, 34% of small businesses are currently closed. This map looks at the small business recovery rate in 50 metro areas.
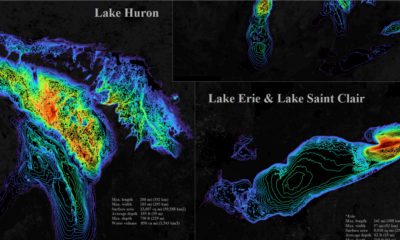

The five Great Lakes account for 21% of the world's total freshwater. This bathymetric visualization dives into just how deep they are.
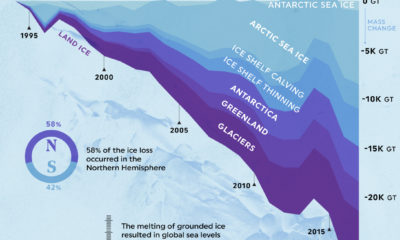

In just over two decades, the planet has seen 28 trillion tonnes in global ice loss. 58% of this ice loss occurred in the Northern Hemisphere.
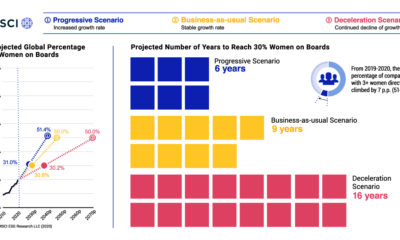

The representation of women on boards of directors a mixed bag. This graphic looks at the 10-year trend of women on corporate boards.


It’s been a long year since the WHO declared the novel coronavirus a global pandemic. This visual looks at key events in the COVID-19 timeline.
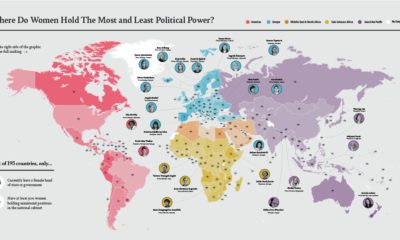

Where do women hold the most ministerial positions? In this map, we look at women's political power by country, and key positions held by women.
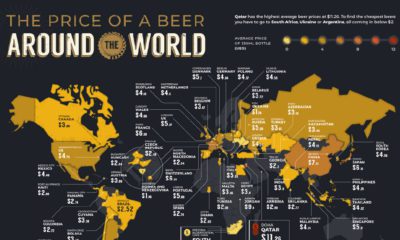

The global desire for beer prevails even in a pandemic. These maps compare the average beer price in 58 countries—just how much do we drink?
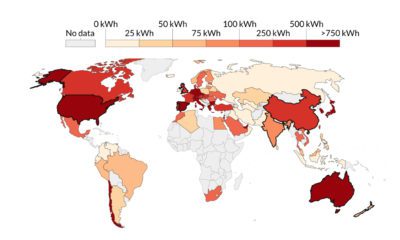

This visualization highlights the growth in solar energy consumption per capita over 54 years. Which countries are leading the way?
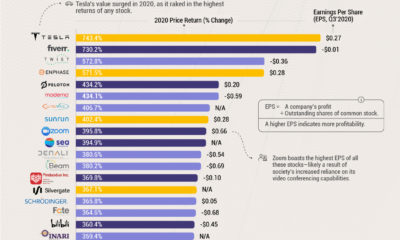

Only a handful of companies thrived in the face of the pandemic. Which of these emerged to become the 20 top stocks of 2020?
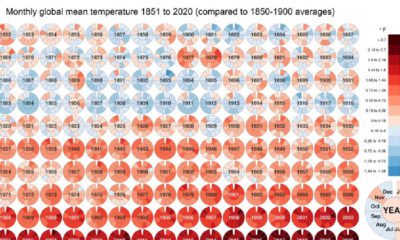

Global Temperature Graph (1851-2020) View the high-resolution of the infographic by clicking here. Since 1880, the Earth’s average surface temperature has risen by 0.07°C (0.13°F) every...
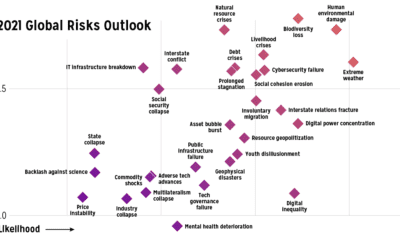

Which risks are top of mind in 2021? We visualize the World Economic Forum's risk assessment for top global risks by impact and livelihood.
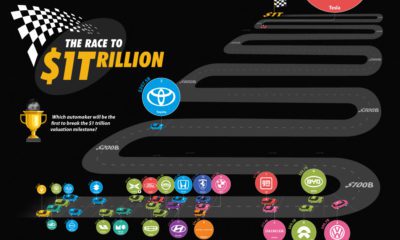

The World’s Top Car Manufacturers by Market Cap View the high-resolution of the infographic by clicking here. Ever since Apple and other Big Tech companies hit...
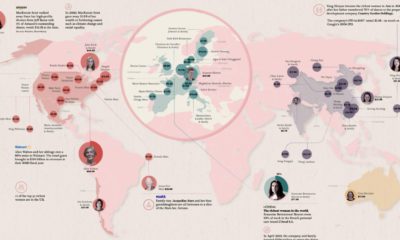

Fewer than 12% of global billionaires are women, but they still hold massive amounts of wealth. Who are the 50 richest women in the world?
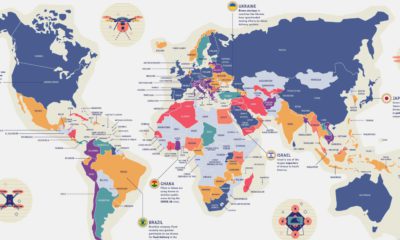

By 2025, the global commercial drone market could reach $42.8 billion. With such diverse uses, how do countries navigate drone privacy laws?
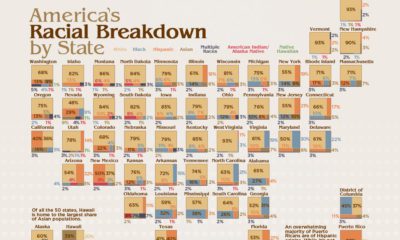

America is a cultural mosaic—nearly 40% identify as a visible minority today. Here we break down the U.S. population by race by state.
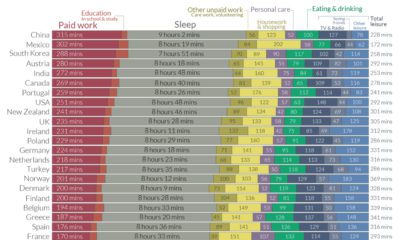

We all have the same 24 hours in the day. How do people spend them around the world, and how does this breakdown change by gender?
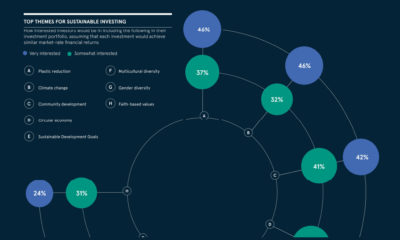

Sustainable investing in the U.S. is smashing records, with $20.9 billion of net flows in H1'2020. Here are 5 key drivers behind this growth.
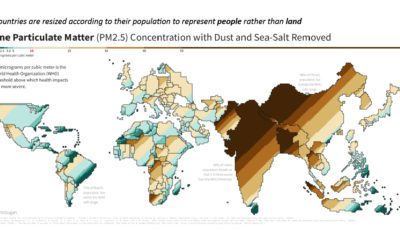

This population-weighted cartogram shows the countries with the worst air pollution, based on fine particulate matter (PM2.5) concentration.
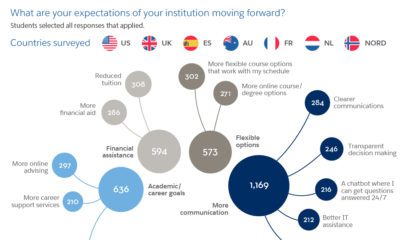

Higher education is facing a new wave of change during the pandemic. What are the new priorities of 2,200 students and staff worldwide?
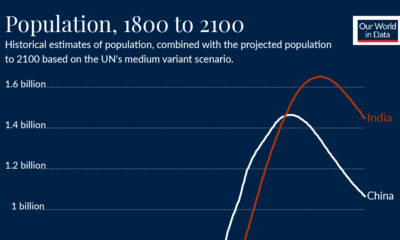

When will India's population overtake China's? Take a look at the trends behind this impending demographic milestone.


 Creator Program