Markets
RCEP Explained: The World’s Biggest Trading Bloc Will Soon be in Asia-Pacific


RCEP Explained: The World’s Biggest Trading Bloc
Trade and commerce are the lifeblood of the global economy. Naturally, agreements among nations in a certain geographical area help facilitate relationships in ways that are ideally beneficial for everyone involved.
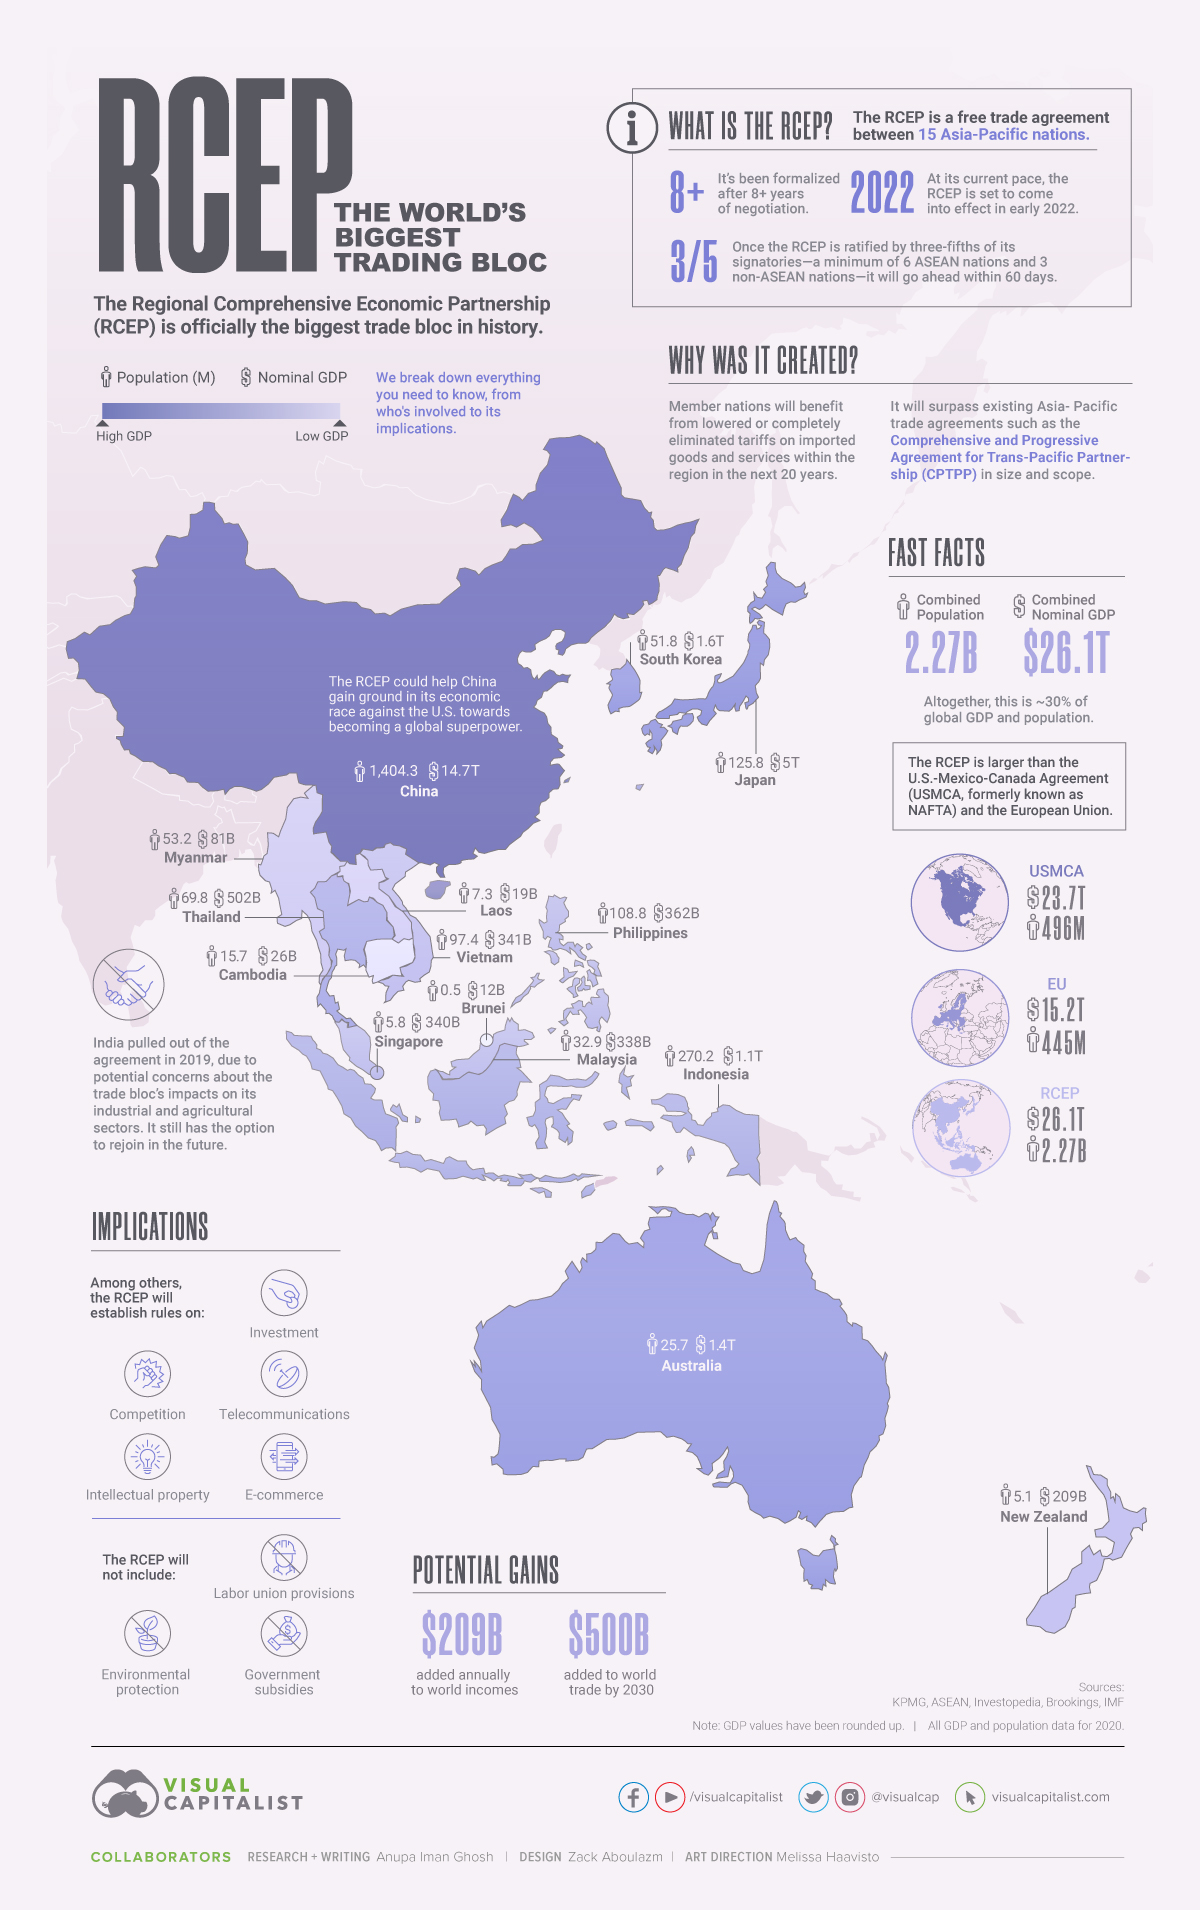
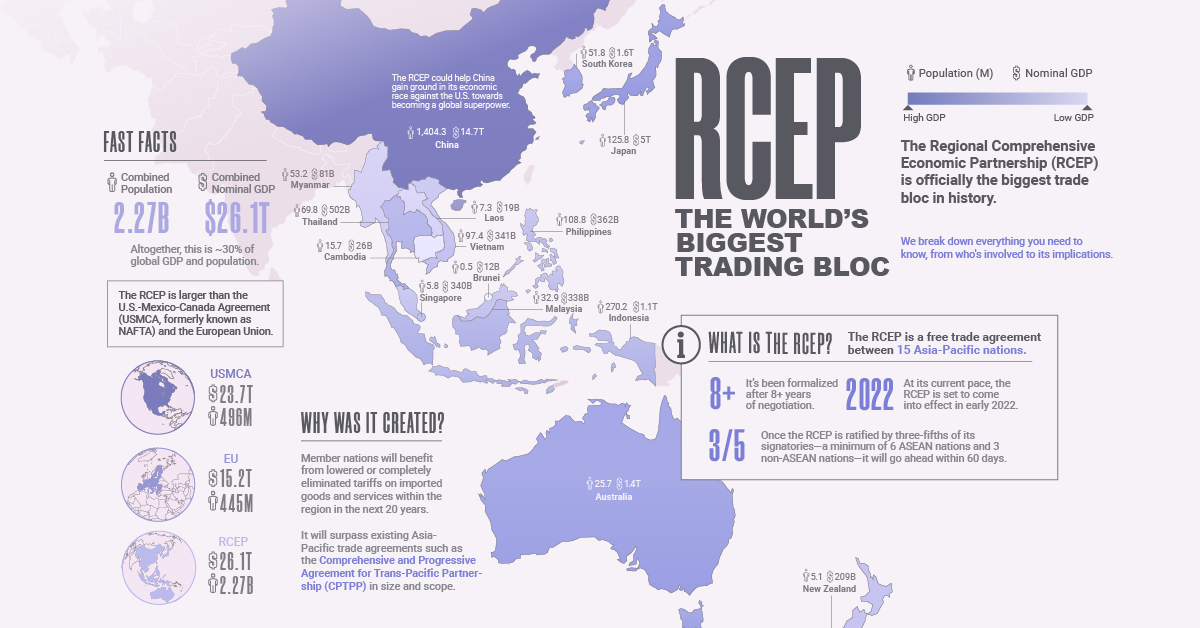
In late 2020, the Regional Comprehensive Economic Partnership (RCEP) was signed, officially creating the biggest trade bloc in history. Here, we break down everything you need to know about it, from who’s involved to its implications.
Who’s in the RCEP, and Why Was it Created?
The RCEP is a free trade agreement between 15 nations in the Asia-Pacific region, and has been formalized after 28 rounds of discussion over eight years.
Member nations who are a part of the RCEP will benefit from lowered or completely eliminated tariffs on imported goods and services within the region in the next 20 years. Here are the countries which have signed on to be member nations:
| Country | Population (M) | Nominal GDP ($B) |
|---|---|---|
| 🇦🇺 Australia | 25.7 | $1,359 |
| 🇧🇳 Brunei | 0.5 | $12 |
| 🇰🇭 Cambodia | 15.7 | $26 |
| 🇨🇳 China | 1404 | $14,723 |
| 🇮🇩 Indonesia | 270.2 | $1,060 |
| 🇯🇵 Japan | 125.8 | $5,049 |
| 🇰🇷 South Korea | 51.8 | $1,631 |
| 🇱🇦 Laos | 7.3 | $19 |
| 🇲🇾 Malaysia | 32.9 | $338 |
| 🇲🇲 Myanmar | 53.2 | $81 |
| 🇳🇿 New Zealand | 5.1 | $209 |
| 🇵🇭 Philippines | 108.8 | $362 |
| 🇸🇬 Singapore | 5.8 | $340 |
| 🇹🇭 Thailand | 69.8 | $502 |
| 🇻🇳 Vietnam | 97.4 | $341 |
| RCEP Total | 2,274.2M | $26,052B |
Source: IMF
But there is still some work to do to bring the trade agreement into full effect.
Signing the agreement, the step taken in late 2020, is simply an initial show of support for the trade agreement, but now it needs to be ratified. That means these nations still have to give their consent to be legally bound to the terms within the RCEP. Once the RCEP is ratified by three-fifths of its signatories—a minimum of six ASEAN nations and three non-ASEAN nations—it will go ahead within 60 days.
So far, it’s been ratified by China, Japan, Thailand, and Singapore as of April 30, 2021. At its current pace, the RCEP is set to come into effect in early 2022 as all member nations have agreed to complete the ratification process within the year.
Interestingly, in the midst of negotiations in 2019, India pulled out of the agreement. This came after potential concerns about the trade bloc’s impacts on its industrial and agricultural sectors that affect the “lives and livelihoods of all Indians”. India retains the option to rejoin the RCEP in the future, if things change.
The Biggest Trading Blocs, Compared
When we say the Regional Comprehensive Economic Partnership is the biggest trade bloc in history, this statement is not hyperbole.
The RCEP will not only surpass existing Asia-Pacific trade agreements such as the Comprehensive and Progressive Agreement for Trans-Pacific Partnership (CPTPP) in size and scope, but also other key regional partnerships in advanced economies.
This includes the European Union and the U.S.-Mexico-Canada Agreement (USMCA, formerly known as NAFTA). How does the trio stack up?
| Nominal GDP, 2020 | Population, 2020 | |
|---|---|---|
| EU | $15.2 trillion | 445 million |
| USMCA | $23.7 trillion | 496 million |
| RCEP | $26.1 trillion | 2.27 billion |
| World | $84.5 trillion | 7.64 billion |
With the combined might of its 15 signatories, the RCEP accounts for approximately 30% of global GDP and population. Interestingly, the total population covered within the RCEP is near or over five times that of the other trade blocs.
Another regional agreement not covered here is the African Continental Free Trade Area (AfCFTA), which is now the largest in terms of participating countries (55 in total), but in the other metrics, the RCEP still emerges superior.
Implications of the Regional Comprehensive Economic Partnership
The potential effects of the RCEP are widespread. Among others, the agreement will establish rules for the region around:
- Investment
- Competition
- E-commerce
- Intellectual property
- Telecommunications
However, there are some key exclusions that have raised critics’ eyebrows. These are:
- Labor union provisions
- Environmental protection
- Government subsidies
The RCEP could also help China gain even more ground in its economic race against the U.S. towards becoming a global superpower.
Last, but most importantly, Brookings estimates that the potential gains from the RCEP are in the high billions: $209 billion could be added annually to world incomes, and $500 billion may be added to world trade by 2030.


Markets
The European Stock Market: Attractive Valuations Offer Opportunities
On average, the European stock market has valuations that are nearly 50% lower than U.S. valuations. But how can you access the market?


European Stock Market: Attractive Valuations Offer Opportunities
Europe is known for some established brands, from L’Oréal to Louis Vuitton. However, the European stock market offers additional opportunities that may be lesser known.
The above infographic, sponsored by STOXX, outlines why investors may want to consider European stocks.
Attractive Valuations
Compared to most North American and Asian markets, European stocks offer lower or comparable valuations.
| Index | Price-to-Earnings Ratio | Price-to-Book Ratio |
|---|---|---|
| EURO STOXX 50 | 14.9 | 2.2 |
| STOXX Europe 600 | 14.4 | 2 |
| U.S. | 25.9 | 4.7 |
| Canada | 16.1 | 1.8 |
| Japan | 15.4 | 1.6 |
| Asia Pacific ex. China | 17.1 | 1.8 |
Data as of February 29, 2024. See graphic for full index names. Ratios based on trailing 12 month financials. The price to earnings ratio excludes companies with negative earnings.
On average, European valuations are nearly 50% lower than U.S. valuations, potentially offering an affordable entry point for investors.
Research also shows that lower price ratios have historically led to higher long-term returns.
Market Movements Not Closely Connected
Over the last decade, the European stock market had low-to-moderate correlation with North American and Asian equities.
The below chart shows correlations from February 2014 to February 2024. A value closer to zero indicates low correlation, while a value of one would indicate that two regions are moving in perfect unison.
| EURO STOXX 50 | STOXX EUROPE 600 | U.S. | Canada | Japan | Asia Pacific ex. China |
|
|---|---|---|---|---|---|---|
| EURO STOXX 50 | 1.00 | 0.97 | 0.55 | 0.67 | 0.24 | 0.43 |
| STOXX EUROPE 600 | 1.00 | 0.56 | 0.71 | 0.28 | 0.48 | |
| U.S. | 1.00 | 0.73 | 0.12 | 0.25 | ||
| Canada | 1.00 | 0.22 | 0.40 | |||
| Japan | 1.00 | 0.88 | ||||
| Asia Pacific ex. China | 1.00 |
Data is based on daily USD returns.
European equities had relatively independent market movements from North American and Asian markets. One contributing factor could be the differing sector weights in each market. For instance, technology makes up a quarter of the U.S. market, but health care and industrials dominate the broader European market.
Ultimately, European equities can enhance portfolio diversification and have the potential to mitigate risk for investors.
Tracking the Market
For investors interested in European equities, STOXX offers a variety of flagship indices:
| Index | Description | Market Cap |
|---|---|---|
| STOXX Europe 600 | Pan-regional, broad market | €10.5T |
| STOXX Developed Europe | Pan-regional, broad-market | €9.9T |
| STOXX Europe 600 ESG-X | Pan-regional, broad market, sustainability focus | €9.7T |
| STOXX Europe 50 | Pan-regional, blue-chip | €5.1T |
| EURO STOXX 50 | Eurozone, blue-chip | €3.5T |
Data is as of February 29, 2024. Market cap is free float, which represents the shares that are readily available for public trading on stock exchanges.
The EURO STOXX 50 tracks the Eurozone’s biggest and most traded companies. It also underlies one of the world’s largest ranges of ETFs and mutual funds. As of November 2023, there were €27.3 billion in ETFs and €23.5B in mutual fund assets under management tracking the index.
“For the past 25 years, the EURO STOXX 50 has served as an accurate, reliable and tradable representation of the Eurozone equity market.”
— Axel Lomholt, General Manager at STOXX
Partnering with STOXX to Track the European Stock Market
Are you interested in European equities? STOXX can be a valuable partner:
- Comprehensive, liquid and investable ecosystem
- European heritage, global reach
- Highly sophisticated customization capabilities
- Open architecture approach to using data
- Close partnerships with clients
- Part of ISS STOXX and Deutsche Börse Group
With a full suite of indices, STOXX can help you benchmark against the European stock market.
Learn how STOXX’s European indices offer liquid and effective market access.

-

 Economy3 days ago
Economic Growth Forecasts for G7 and BRICS Countries in 2024
The IMF has released its economic growth forecasts for 2024. How do the G7 and BRICS countries compare?
-

 Markets2 weeks ago
U.S. Debt Interest Payments Reach $1 Trillion
U.S. debt interest payments have surged past the $1 trillion dollar mark, amid high interest rates and an ever-expanding debt burden.
-

 United States2 weeks ago
Ranked: The Largest U.S. Corporations by Number of Employees
We visualized the top U.S. companies by employees, revealing the massive scale of retailers like Walmart, Target, and Home Depot.
-

 Markets2 weeks ago
The Top 10 States by Real GDP Growth in 2023
This graphic shows the states with the highest real GDP growth rate in 2023, largely propelled by the oil and gas boom.
-

 Markets3 weeks ago
Ranked: The World’s Top Flight Routes, by Revenue
In this graphic, we show the highest earning flight routes globally as air travel continued to rebound in 2023.
-

 Markets3 weeks ago
Ranked: The Most Valuable Housing Markets in America
The U.S. residential real estate market is worth a staggering $47.5 trillion. Here are the most valuable housing markets in the country.


-

 Sports1 week ago
The Highest Earning Athletes in Seven Professional Sports
-

 Countries2 weeks ago
Population Projections: The World’s 6 Largest Countries in 2075
-
Markets2 weeks ago
The Top 10 States by Real GDP Growth in 2023
-

 Demographics2 weeks ago
The Smallest Gender Wage Gaps in OECD Countries
-

 United States2 weeks ago
Where U.S. Inflation Hit the Hardest in March 2024
-

 Green2 weeks ago
Top Countries By Forest Growth Since 2001
-
United States2 weeks ago
Ranked: The Largest U.S. Corporations by Number of Employees
-

 Maps2 weeks ago
The Largest Earthquakes in the New York Area (1970-2024)