Markets
The Biggest Business Risks in 2021
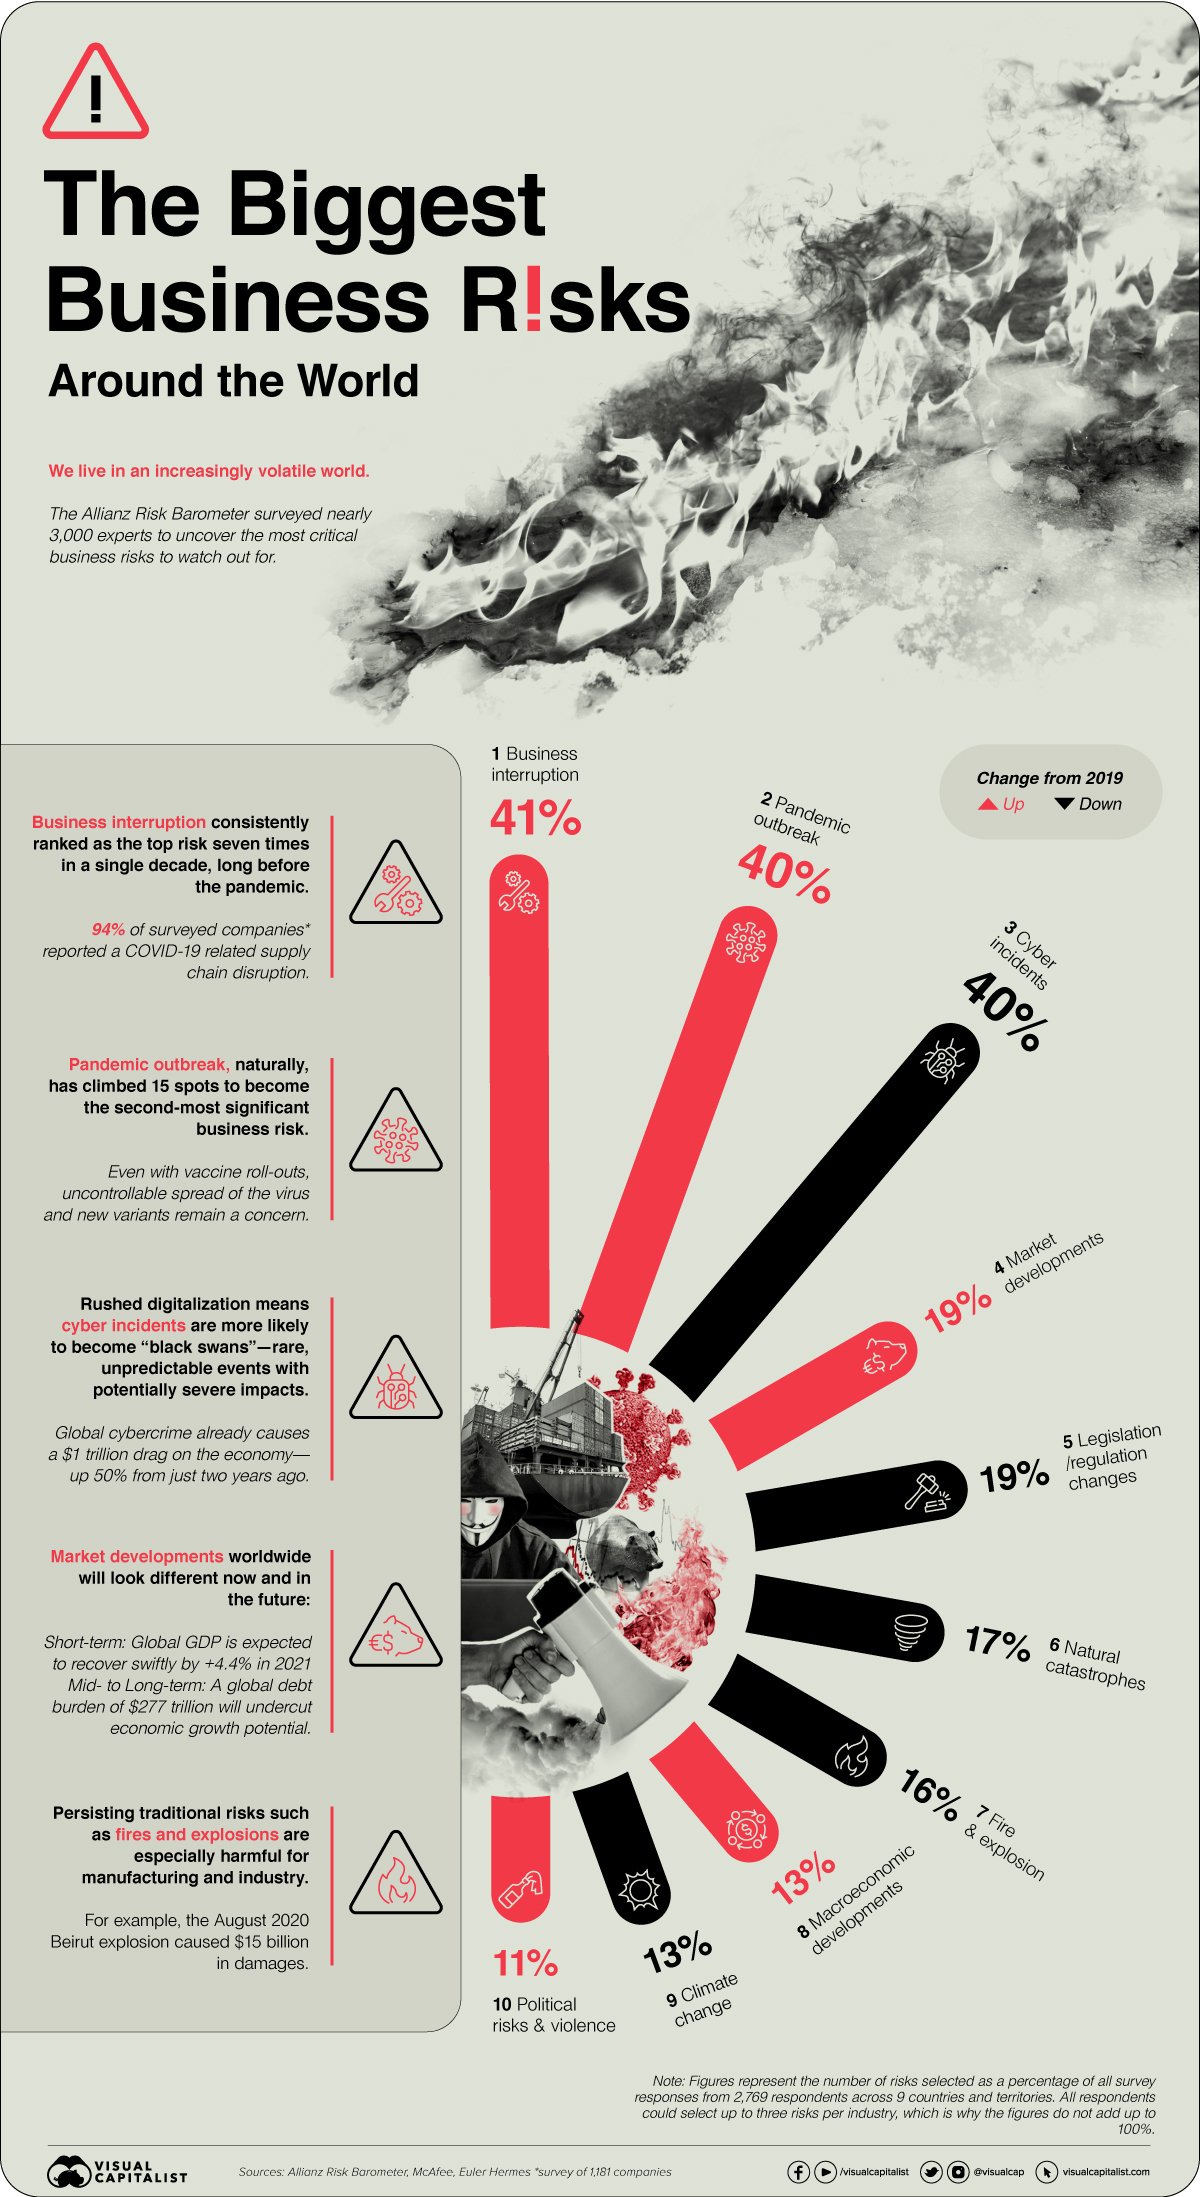


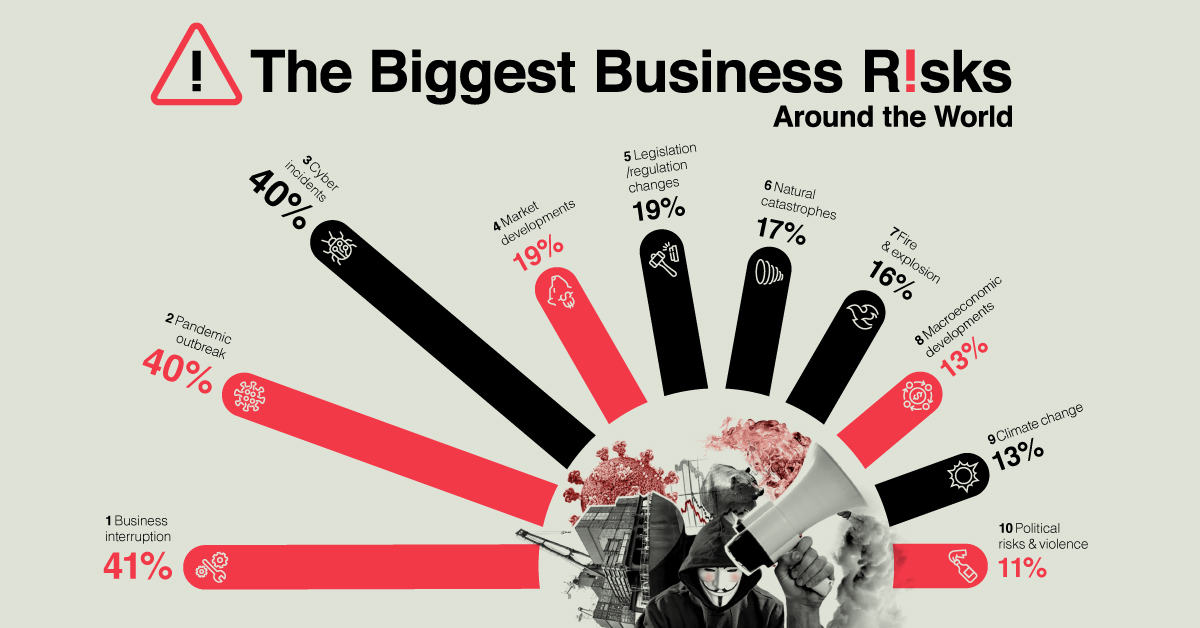
The Biggest Business Risks Around the World
We live in an increasingly volatile world, where change is the only constant.
Businesses, too, face rapidly changing environments and associated risks that they need to adapt to—or risk falling behind. These can range from supply chain issues due to shipping blockages, to disruptions from natural catastrophes.
As countries and companies continue to grapple with the effects of the pandemic, nearly 3,000 risk management experts were surveyed for the Allianz Risk Barometer, uncovering the top 10 business risks that leaders must watch out for in 2021.
The Top 10 Business Risks: The Pandemic Trio Emerges
Business Interruption tops the charts consistently as the biggest business risk. This risk has slotted into the #1 spot seven times in the last decade of the survey, showing it has been on the minds of business leaders well before the pandemic began.
However, that is not to say that the pandemic hasn’t made awareness of this risk more acute. In fact, 94% of surveyed companies reported a COVID-19 related supply chain disruption in 2020.
| Rank (2021) | % Responses | Risk Name | Business Risk Examples | Change from 2020 |
|---|---|---|---|---|
| #1 | 41% | Business Interruption | Supply chain disruptions | ↑ |
| #2 | 40% | Pandemic Outbreak | Health and workforce issues, restrictions on movement | ↑ |
| #3 | 40% | Cyber Incidents | Cybercrime, IT failure/outage, data breaches, fines and penalties | ↓ |
| #4 | 19% | Market Developments | Volatility, intensified competition/new entrants, M&A, market stagnation, market fluctuation | ↑ |
| #5 | 19% | Legislation/ Regulation Changes | Trade wars and tariffs, economic sanctions, protectionism, Brexit, Euro-zone disintegration | ↓ |
| #6 | 17% | Natural Catastrophes | Storm, flood, earthquake, wildfire | ↓ |
| #7 | 16% | Fire, Explosion | - | ↓ |
| #8 | 13% | Macroeconomic Developments | Monetary policies, austerity programs, commodity price increase, deflation, inflation | ↑ |
| #9 | 13% | Climate Change | - | ↓ |
| #10 | 11% | Political Risks And Violence | Political instability, war, terrorism, civil commotion, riots and looting | ↑ |
Note: Figures do not add to 100% as respondents could select up to three risks per industry.
Pandemic Outbreak, naturally, has climbed 15 spots to become the second-most significant business risk. Even with vaccine roll-outs, the uncontrollable spread of the virus and new variants remain a concern.
The third most prominent business risk, Cyber Incidents, are also on the rise. Global cybercrime already causes a $1 trillion drag on the economy—a 50% jump from just two years ago. In addition, the pandemic-induced rush towards digitalization leaves businesses increasingly susceptible to cyber incidents.
Other Socio-Economic Business Risks
The top three risks mentioned above are considered the “pandemic trio”, owing to their inextricable and intertwined effects on the business world. However, these next few notable business risks are also not far behind.
Globally, GDP is expected to recover by +4.4% in 2021, compared to the -4.5% contraction from 2020. These Market Developments may also see a short-term 2 percentage point increase in GDP growth estimates in the event of rapid and successful vaccination campaigns.
In the long term, however, the world will need to contend with a record of $277 trillion worth of debt, which may potentially affect these economic growth projections. Rising insolvency rates also remain a key post-COVID concern.
Persisting traditional risks such as Fires and Explosions are especially damaging for manufacturing and industry. For example, the August 2020 Beirut explosion caused $15 billion in damages.
What’s more, Political Risks And Violence have escalated in number, scale, and duration worldwide in the form of civil unrest and protests. Such disruption is often underestimated, but insured losses can add up into the billions.
No Such Thing as a Risk-Free Life
The risks that businesses face depend on a multitude of factors, from political (in)stability and growing regulations to climate change and macroeconomic shifts.
Will a post-pandemic world accentuate these global business risks even further, or will something entirely new rear its head?


Markets
The European Stock Market: Attractive Valuations Offer Opportunities
On average, the European stock market has valuations that are nearly 50% lower than U.S. valuations. But how can you access the market?


European Stock Market: Attractive Valuations Offer Opportunities
Europe is known for some established brands, from L’Oréal to Louis Vuitton. However, the European stock market offers additional opportunities that may be lesser known.
The above infographic, sponsored by STOXX, outlines why investors may want to consider European stocks.
Attractive Valuations
Compared to most North American and Asian markets, European stocks offer lower or comparable valuations.
| Index | Price-to-Earnings Ratio | Price-to-Book Ratio |
|---|---|---|
| EURO STOXX 50 | 14.9 | 2.2 |
| STOXX Europe 600 | 14.4 | 2 |
| U.S. | 25.9 | 4.7 |
| Canada | 16.1 | 1.8 |
| Japan | 15.4 | 1.6 |
| Asia Pacific ex. China | 17.1 | 1.8 |
Data as of February 29, 2024. See graphic for full index names. Ratios based on trailing 12 month financials. The price to earnings ratio excludes companies with negative earnings.
On average, European valuations are nearly 50% lower than U.S. valuations, potentially offering an affordable entry point for investors.
Research also shows that lower price ratios have historically led to higher long-term returns.
Market Movements Not Closely Connected
Over the last decade, the European stock market had low-to-moderate correlation with North American and Asian equities.
The below chart shows correlations from February 2014 to February 2024. A value closer to zero indicates low correlation, while a value of one would indicate that two regions are moving in perfect unison.
| EURO STOXX 50 | STOXX EUROPE 600 | U.S. | Canada | Japan | Asia Pacific ex. China |
|
|---|---|---|---|---|---|---|
| EURO STOXX 50 | 1.00 | 0.97 | 0.55 | 0.67 | 0.24 | 0.43 |
| STOXX EUROPE 600 | 1.00 | 0.56 | 0.71 | 0.28 | 0.48 | |
| U.S. | 1.00 | 0.73 | 0.12 | 0.25 | ||
| Canada | 1.00 | 0.22 | 0.40 | |||
| Japan | 1.00 | 0.88 | ||||
| Asia Pacific ex. China | 1.00 |
Data is based on daily USD returns.
European equities had relatively independent market movements from North American and Asian markets. One contributing factor could be the differing sector weights in each market. For instance, technology makes up a quarter of the U.S. market, but health care and industrials dominate the broader European market.
Ultimately, European equities can enhance portfolio diversification and have the potential to mitigate risk for investors.
Tracking the Market
For investors interested in European equities, STOXX offers a variety of flagship indices:
| Index | Description | Market Cap |
|---|---|---|
| STOXX Europe 600 | Pan-regional, broad market | €10.5T |
| STOXX Developed Europe | Pan-regional, broad-market | €9.9T |
| STOXX Europe 600 ESG-X | Pan-regional, broad market, sustainability focus | €9.7T |
| STOXX Europe 50 | Pan-regional, blue-chip | €5.1T |
| EURO STOXX 50 | Eurozone, blue-chip | €3.5T |
Data is as of February 29, 2024. Market cap is free float, which represents the shares that are readily available for public trading on stock exchanges.
The EURO STOXX 50 tracks the Eurozone’s biggest and most traded companies. It also underlies one of the world’s largest ranges of ETFs and mutual funds. As of November 2023, there were €27.3 billion in ETFs and €23.5B in mutual fund assets under management tracking the index.
“For the past 25 years, the EURO STOXX 50 has served as an accurate, reliable and tradable representation of the Eurozone equity market.”
— Axel Lomholt, General Manager at STOXX
Partnering with STOXX to Track the European Stock Market
Are you interested in European equities? STOXX can be a valuable partner:
- Comprehensive, liquid and investable ecosystem
- European heritage, global reach
- Highly sophisticated customization capabilities
- Open architecture approach to using data
- Close partnerships with clients
- Part of ISS STOXX and Deutsche Börse Group
With a full suite of indices, STOXX can help you benchmark against the European stock market.
Learn how STOXX’s European indices offer liquid and effective market access.

-

 Economy3 days ago
Economic Growth Forecasts for G7 and BRICS Countries in 2024
The IMF has released its economic growth forecasts for 2024. How do the G7 and BRICS countries compare?
-

 Markets2 weeks ago
U.S. Debt Interest Payments Reach $1 Trillion
U.S. debt interest payments have surged past the $1 trillion dollar mark, amid high interest rates and an ever-expanding debt burden.
-

 United States2 weeks ago
Ranked: The Largest U.S. Corporations by Number of Employees
We visualized the top U.S. companies by employees, revealing the massive scale of retailers like Walmart, Target, and Home Depot.
-

 Markets2 weeks ago
The Top 10 States by Real GDP Growth in 2023
This graphic shows the states with the highest real GDP growth rate in 2023, largely propelled by the oil and gas boom.
-

 Markets3 weeks ago
Ranked: The World’s Top Flight Routes, by Revenue
In this graphic, we show the highest earning flight routes globally as air travel continued to rebound in 2023.
-

 Markets3 weeks ago
Ranked: The Most Valuable Housing Markets in America
The U.S. residential real estate market is worth a staggering $47.5 trillion. Here are the most valuable housing markets in the country.


-

 Science1 week ago
Visualizing the Average Lifespans of Mammals
-

 Demographics2 weeks ago
The Smallest Gender Wage Gaps in OECD Countries
-

 United States2 weeks ago
Where U.S. Inflation Hit the Hardest in March 2024
-

 Green2 weeks ago
Top Countries By Forest Growth Since 2001
-
United States2 weeks ago
Ranked: The Largest U.S. Corporations by Number of Employees
-

 Maps2 weeks ago
The Largest Earthquakes in the New York Area (1970-2024)
-

 Green2 weeks ago
Ranked: The Countries With the Most Air Pollution in 2023
-

 Green2 weeks ago
Ranking the Top 15 Countries by Carbon Tax Revenue