Misc
The Biggest Ammonium Nitrate Explosions Since 2000
The Biggest Ammonium Nitrate Explosions since 2000
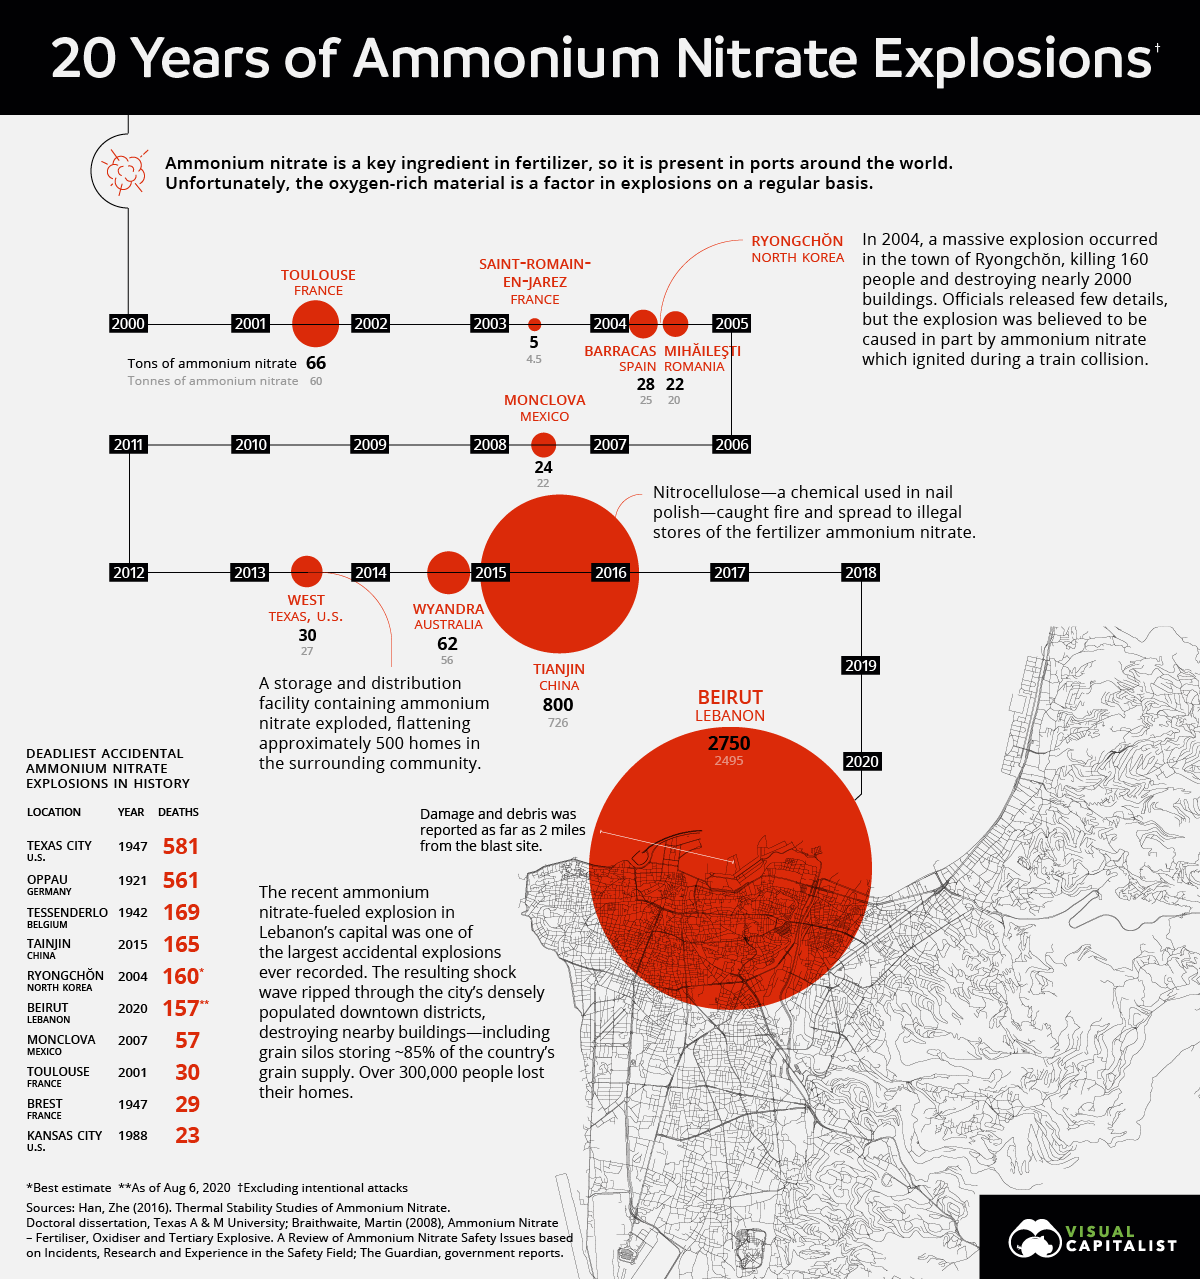
This week, a massive explosion involving ammonium nitrate rocked the city of Beirut, sending shock waves through the media.
This recent tragedy is devastating, and unfortunately, it’s not the first time this dangerous chemical compound has caused widespread damage.
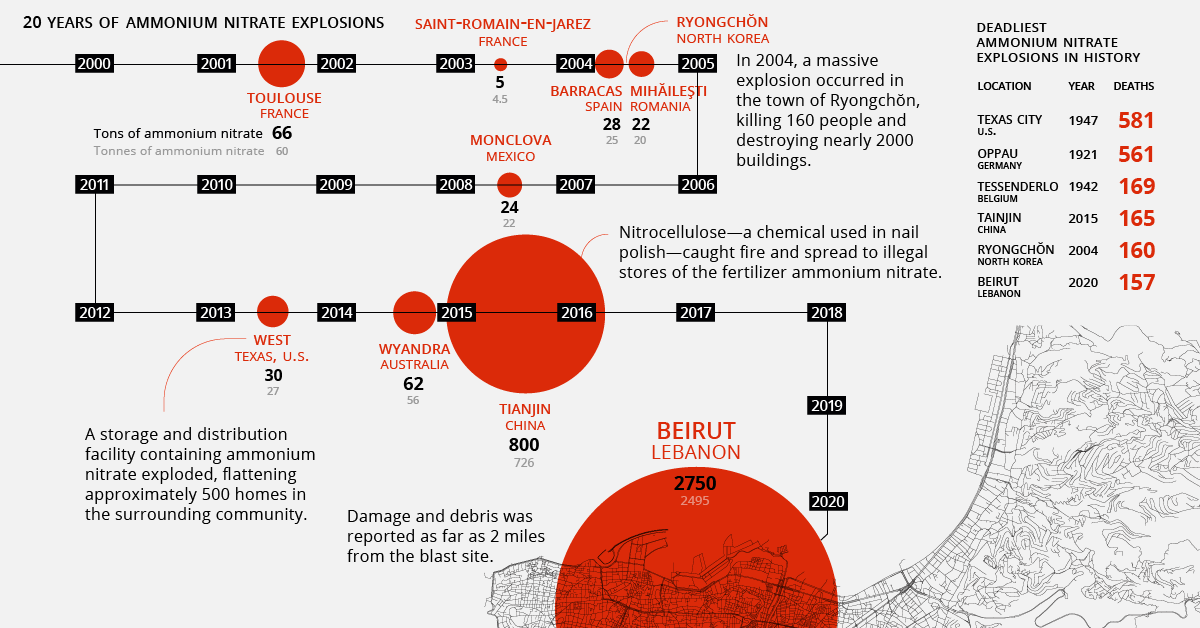
Today’s graphic outlines the biggest accidental ammonium nitrate explosions over the last 20 years.
A Brief Explanation of Ammonium Nitrate
Before getting into the details, first thing’s first—what is ammonium nitrate?
Ammonium nitrate is formed when ammonia gas is combined with liquid nitric acid. The chemical compound is widely used in agriculture as a fertilizer, but it’s also used in mining explosives. It’s highly combustible when combined with oils and other fuels, but not flammable on its own unless exposed to extremely high temperatures.
It’s actually relatively tough for a fire to cause an ammonium nitrate explosion—but that hasn’t stopped it from happening numerous times in the last few decades.
The Death Toll
Some explosions involving ammonium nitrate have been deadlier than others. Here’s a breakdown of the death toll from each blast:
| Year | Location | Country | Deaths |
|---|---|---|---|
| 2015 | Tianjin | China | 165 |
| 2004 | Ryongchon | North Korea | 160 |
| 2020 | Beirut | Lebanon | 157* |
| 2007 | Monclova | Mexico | 57 |
| 2001 | Toulouse | France | 30 |
| 2003 | Saint-Romain-en-Jarez | France | 26 |
| 2004 | Mihăileşti | Romania | 18 |
| 2013 | West | United States | 15 |
| 2004 | Barracas | Spain | 2 |
| 2014 | Wyandra | Australia | 0 |
*Note: death count in Beirut as of Aug 6, 2020. Casualty count expected to increase as more information comes available.
One of the deadliest explosions happened in Tianjin, China in 2015. A factory was storing flammable chemicals with ammonium nitrate, and because they weren’t being stored properly, one of the chemicals got too dry and caught fire. The blast killed 165 people and caused $1.1 billion dollars in damage.
In 2001, 14 years before the explosion in Tianjin, a factory exploded in Toulouse, France. The accident killed 30 people and injured 2,500. The power of the blast was equivalent to 20 to 40 tons of TNT, meaning that 40 to 80 tons of ammonium nitrate would have ignited.
In addition to factory explosions, there have been several transportation accidents involving ammonium nitrate. In 2007, a truck in Mexico blew up and killed over 57 people. Filled with explosives, the truck crashed into a pickup, caught fire, and detonated. The blast left a 60-foot long crater in its wake.
The Aftermath
While there have been several ammonium nitrate accidents throughout history, the recent tragedy in Beirut is one of the largest accidental explosions ever recorded, with 157 deaths and 5,000 injuries and counting.
In terms of TNT equivalent, a measure used to gauge the impact of an explosion, it ranks in the top 10 of the largest accidental explosions in history:
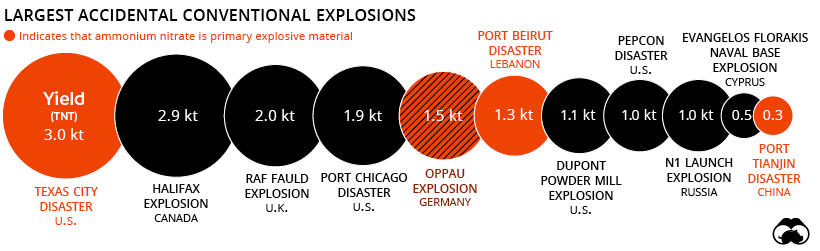
Topping the list is yet another ammonium nitrate explosion, this time back in 1947.
Known to history as the Texas City Disaster, the port accident was one of the biggest non-nuclear explosions to occur in history. The explosion killed over 500 people and injured thousands. The impact from the blast was so intense, it created a 15-foot wave that crashed along the docks and caused flooding in the area.
A Resource With Trade-Offs
Despite being dangerous, ammonium nitrate is still a valuable resource. There’s been an increased demand for the chemical from North America’s agricultural sector, and because of this, ammonium nitrate’s market size is expected to see an increase of more than 3% by 2026.
Because of its increasing market size, it’s more important than ever for trade industries to enforce proper safety measures when storing and transporting ammonium nitrate. When safety regulations aren’t followed, accidents can happen—and as we saw this week, the aftermath can be devastating.


Misc
Visualizing the Most Common Pets in the U.S.
Lions, tigers, and bears, oh my!—these animals do not feature on this list of popular American household pets.


Visualizing The Most Common Pets in the U.S.
This was originally posted on our Voronoi app. Download the app for free on iOS or Android and discover incredible data-driven charts from a variety of trusted sources.
In this graphic, we visualized the most common American household pets, based on 2023-2024 data from the American Pet Products Association (accessed via Forbes Advisor).
Figures represent the number of households that own each pet type, rather than the actual number of each animal. The “small animal” category includes hamsters, gerbils, rabbits, guinea pigs, chinchillas, mice, rats, and ferrets.
What is the Most Popular American Household Pet?
Based on this data, dogs—one of the first domesticated animals—are the most common pets in the United States. In fact, around 65 million households own a dog, and spend an average of $900 a year on their care.
| Rank | Species | Households |
|---|---|---|
| 1 | 🐶 Dog | 65M |
| 2 | 🐱 Cat | 47M |
| 3 | 🐟 Freshwater Fish | 11M |
| 4 | 🐰 Small Animals | 7M |
| 5 | 🐦 Bird | 6M |
| 6 | 🦎 Reptile | 6M |
| 7 | 🐴 Horse | 2M |
| 8 | 🐠 Saltwater Fish | 2M |
Note: Households can own multiple pets, and are counted for all relevant categories.
Cats rank second, at 47 million households, and these smaller felines are a little less expensive to own at $700/year according to Forbes estimates.
But aside from these two juggernauts, there are plenty of other common pet types found in households across the country.
Freshwater fish can be found in 11 million households, along with small animals—rabbits, hamsters, guinea pigs—in 7 million. Meanwhile, nearly 6 million homes have birds or reptiles.
Pet Ownership is on the Rise in America
Forbes found that 66% of all American households (numbering 87 million) own at least one pet, up from 56% in 1988. One third of these (29 million) own multiple pets.
A combination of factors is driving this increase: rising incomes, delayed childbirth, and of course the impact of the pandemic which nearly cleared out animal shelters across the globe.
America’s loneliness epidemic may also be a factor. Fledgling research has shown that single-individual households with pets recorded lower rates of loneliness during the pandemic than those without a pet.

-

 Science1 week ago
Visualizing the Average Lifespans of Mammals
-

 Markets2 weeks ago
The Top 10 States by Real GDP Growth in 2023
-

 Demographics2 weeks ago
The Smallest Gender Wage Gaps in OECD Countries
-

 United States2 weeks ago
Where U.S. Inflation Hit the Hardest in March 2024
-

 Green2 weeks ago
Top Countries By Forest Growth Since 2001
-

 United States2 weeks ago
Ranked: The Largest U.S. Corporations by Number of Employees
-

 Maps2 weeks ago
The Largest Earthquakes in the New York Area (1970-2024)
-

 Green2 weeks ago
Ranked: The Countries With the Most Air Pollution in 2023