Business
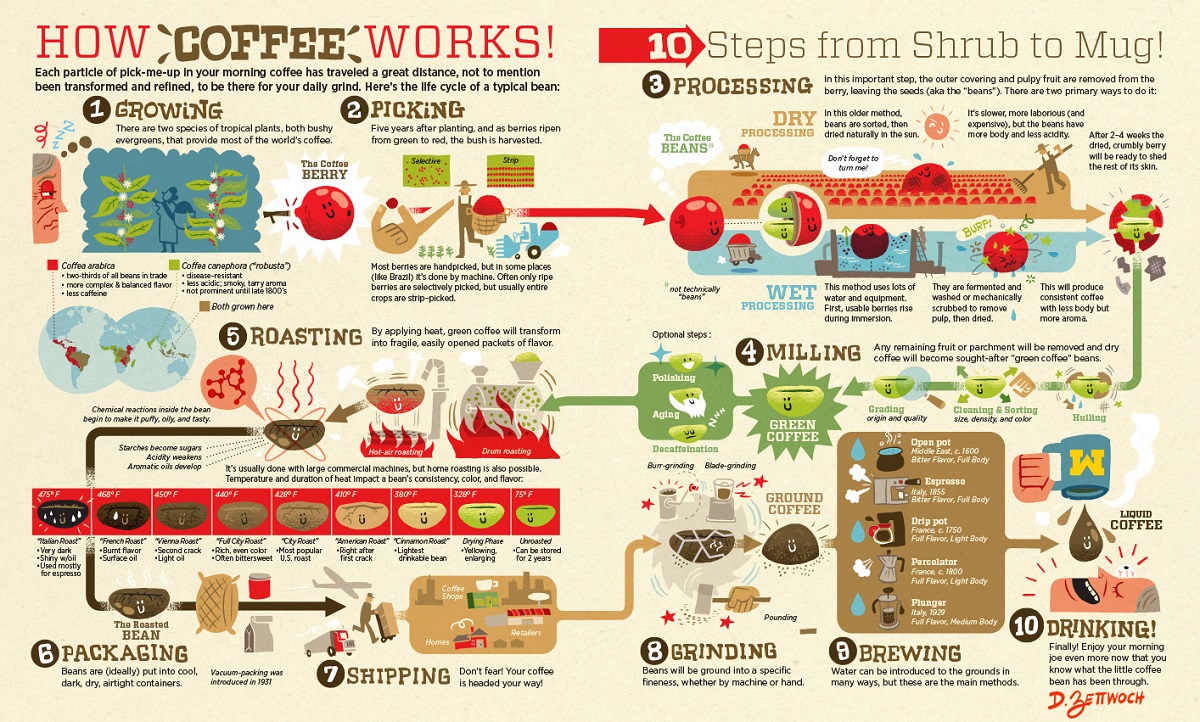
From Bean to Brew: The Coffee Supply Chain
View a more detailed version of this graphic
What Does The Coffee Supply Chain Look Like?
View a more detailed version of the above graphic by clicking here
There’s a good chance your day started with a cappuccino, or a cold brew, and you aren’t alone. In fact, coffee is one of the most consumed drinks on the planet, and it’s also one of the most traded commodities.
According to the National Coffee Association, more than 150 million people drink coffee on a daily basis in the U.S. alone. Globally, consumption is estimated at over 2.25 billion cups per day.
But before it gets to your morning cup, coffee beans travel through a complex global supply chain. Today’s illustration from Dan Zettwoch breaks down this journey into 10 distinct steps.
Coffee From Plant to Factory
There are two types of tropical plants that produce coffee, both preferring high altitudes and with production primarily based in South America, Asia, and Africa.
- Coffea arabica is the more plentiful bean, with a more complex flavor and less caffeine. It’s used in most specialty and “high quality” drinks as Arabica coffee.
- Coffea canephora, meanwhile, has stronger and more bitter flavors. It’s also easier to grow, and is most frequently used in espressos and instant blends as Robusta coffee.
However, both types of beans undergo the same journey:
- Growing
Plants take anywhere from 4-7 years to produce their first harvest, and grow fruit for around 25 years. - Picking
The fruit of the coffea plant is the coffee berry, containing two beans within. Ripened berries are harvested either by hand or machine. - Processing
Coffee berries are then processed either in a traditional “dry” method using the sun or “wet” method using water and machinery. This removes the outer fruit encasing the sought-after green beans. - Milling
The green coffee beans are hulled, cleaned, sorted, and (optionally) graded.
From Factory to Transport
Once the coffee berry is stripped down to green beans, it’s shipped from producing countries through a global supply network.
Green coffee beans are exported and shipped around the world. In 2018 alone, 7.2 million tonnes of green coffee beans were exported, valued at $19.2 billion.
Arriving primarily in the U.S. and Europe, the beans are now prepared for consumption:
- Roasting
Green beans are industrially roasted, becoming darker, oilier, and tasty. Different temperatures and heat duration impact the final color and flavor, with some preferring light roasts to dark roasts. - Packaging
Any imperfect or somehow ruined beans are discarded, and the remaining roasted beans are packaged together by type. - Shipping
Roasted beans are shipped both domestically and internationally. Bulk shipments go to retailers, coffee shops, and in some cases, direct to consumer.
Straight to Your Cup
Roasted coffee beans are almost ready for consumption, and by this stage the remaining steps can happen anywhere.
For example, many factories don’t ship roasted beans until they grind it themselves. Meanwhile, cafes will grind their own beans on-site before preparing drinks. The rapid growth of coffee chains made Starbucks the second-highest-earning U.S. fast food venue.
Regardless of where it happens, the final steps bring coffee straight to your cup:
- Grinding
Roasted beans are ground up in order to better extract their flavors, either by machine or by hand. The preferred fineness depends on the darkness of the roast and the brewing method. - Brewing
Water is added to the coffee grounds in a variety of methods. Some involve water being passed or pressured through the grounds (espresso, drip) while others mix the water and grounds (French press, Turkish coffee). - Drinking
Liquid coffee is ready to be enjoyed! One average cup takes 70 roasted beans to make.
The world’s choice of caffeine pick-me-up is made possible by this structured and complex supply chain. Coffee isn’t just a drink, after all, it’s a business.
Support the Future of Data Storytelling
Sorry to interrupt your reading, but we have a favor to ask. At Visual Capitalist we believe in a world where data can be understood by everyone. That’s why we want to build the VC App - the first app of its kind combining verifiable and transparent data with beautiful, memorable visuals. All available for free.
As a small, independent media company we don’t have the expertise in-house or the funds to build an app like this. So we’re asking our community to help us raise funds on Kickstarter.
If you believe in data-driven storytelling, join the movement and back us on Kickstarter!
Thank you.

Markets
30 Years of Gun Manufacturing in America
The U.S. has produced nearly 170 million firearms over the past three decades. Here are the numbers behind America’s gun manufacturing sector.

30 Years of Gun Manufacturing in America
While gun sales have been brisk in recent years, the uncertainty surrounding COVID-19 was a boon for the gun industry.
From 2010-2019, an average of 13 million guns were sold legally in the U.S. each year. In 2020 and 2021, annual gun sales sharply increased to 20 million.
While the U.S. does import millions of weapons each year, a large amount of firearms sold in the country were produced domestically. Let’s dig into the data behind the multi-billion dollar gun manufacturing industry in America.
Gun Manufacturing in the United States
According to a recent report from the Bureau of Alcohol, Tobacco, Firearms and Explosives (ATF), the U.S. has produced nearly 170 million firearms over the past three decades, with production increasing sharply in recent years.
America’s gunmakers produce a wide variety of firearms, but they’re generally grouped into five categories; pistols, rifles, shotguns, revolvers, and everything else.
Below is a breakdown of firearms manufactured in the country over the past 30 years, by type:
Year | Pistols | Rifles | Revolvers | Shotguns | Misc. Firearms | Total Firearms |
---|---|---|---|---|---|---|
1989 | 1,404,753 | 1,407,400 | 628,573 | 935,541 | 42,126 | 4,418,393 |
1990 | 1,371,427 | 1,211,664 | 470,495 | 848,948 | 57,434 | 3,959,968 |
1991 | 1,378,252 | 883,482 | 456,966 | 828,426 | 15,980 | 3,563,106 |
1992 | 1,669,537 | 1,001,833 | 469,413 | 1,018,204 | 16,849 | 4,175,836 |
1993 | 2,093,362 | 1,173,694 | 562,292 | 1,144,940 | 81,349 | 5,055,637 |
1994 | 2,004,298 | 1,316,607 | 586,450 | 1,254,926 | 10,936 | 5,173,217 |
1995 | 1,195,284 | 1,411,120 | 527,664 | 1,173,645 | 8,629 | 4,316,342 |
1996 | 987,528 | 1,424,315 | 498,944 | 925,732 | 17,920 | 3,854,439 |
1997 | 1,036,077 | 1,251,341 | 370,428 | 915,978 | 19,680 | 3,593,504 |
1998 | 960,365 | 1,535,690 | 324,390 | 868,639 | 24,506 | 3,713,590 |
1999 | 995,446 | 1,569,685 | 335,784 | 1,106,995 | 39,837 | 4,047,747 |
2000 | 962,901 | 1,583,042 | 318,960 | 898,442 | 30,196 | 3,793,541 |
2001 | 626,836 | 1,284,554 | 320,143 | 679,813 | 21,309 | 2,932,655 |
2002 | 741,514 | 1,515,286 | 347,070 | 741,325 | 21,700 | 3,366,895 |
2003 | 811,660 | 1,430,324 | 309,364 | 726,078 | 30,978 | 3,308,404 |
2004 | 728,511 | 1,325,138 | 294,099 | 731,769 | 19,508 | 3,099,025 |
2005 | 803,425 | 1,431,372 | 274,205 | 709,313 | 23,179 | 3,241,494 |
2006 | 1,021,260 | 1,496,505 | 385,069 | 714,618 | 35,872 | 3,653,324 |
2007 | 1,219,664 | 1,610,923 | 391,334 | 645,231 | 55,461 | 3,922,613 |
2008 | 1,609,381 | 1,734,536 | 431,753 | 630,710 | 92,564 | 4,498,944 |
2009 | 1,868,258 | 2,248,851 | 547,195 | 752,699 | 138,815 | 5,555,818 |
2010 | 2,258,450 | 1,830,556 | 558,927 | 743,378 | 67,929 | 5,459,240 |
2011 | 2,598,133 | 2,318,088 | 572,857 | 862,401 | 190,407 | 6,541,886 |
2012 | 3,487,883 | 3,168,206 | 667,357 | 949,010 | 306,154 | 8,578,610 |
2013 | 4,441,726 | 3,979,570 | 725,282 | 1,203,072 | 495,142 | 10,844,792 |
2014 | 3,633,454 | 3,379,549 | 744,047 | 935,411 | 358,165 | 9,050,626 |
2015 | 3,557,199 | 3,691,799 | 885,259 | 777,273 | 447,131 | 9,358,661 |
2016 | 4,720,075 | 4,239,335 | 856,291 | 848,617 | 833,123 | 11,497,441 |
2017 | 3,691,010 | 2,504,092 | 720,917 | 653,139 | 758,634 | 8,327,792 |
2018 | 3,881,158 | 2,880,536 | 664,835 | 536,126 | 1,089,973 | 9,052,628 |
2019 | 3,046,013 | 1,957,667 | 580,601 | 480,735 | 946,929 | 7,011,945 |
Total | 60,804,840 | 59,796,760 | 15,826,964 | 26,241,134 | 6,298,415 | 168,968,113 |
Pistols (36%) and rifles (35%) are the dominant categories, and over time, the former has become the most commonly produced firearm type.
In 2001, pistols accounted for 21% of firearms produced. Today, nearly half of all firearms produced are pistols.
Who is Producing America’s Firearms?
There are a wide variety of firearm manufacturing companies in the U.S., but production is dominated by a few key players.
Here are the top 10 gunmakers in America, which collectively make up 70% of production:
Rank | Firearm Manufacturer | Guns Produced (2016-2020) | Share of total |
---|---|---|---|
1 | Smith & Wesson Corp | 8,218,199 | 17.2% |
2 | Sturm, Ruger & Company, Inc | 8,166,448 | 17.1% |
3 | Sig Sauer Inc | 3,660,629 | 7.7% |
4 | Freedom Group | 3,045,427 | 6.4% |
5 | 0 F Mossberg & Sons Inc | 2,223,241 | 4.7% |
6 | Taurus International Manufacturing | 1,996,121 | 4.2% |
7 | WM C Anderson Inc | 1,816,625 | 3.8% |
8 | Glock Inc | 1,510,437 | 3.2% |
9 | Henry RAC Holding Corp | 1,378,544 | 2.9% |
10 | JIE Capital Holdings / Enterprises | 1,258,969 | 2.6% |
Total | 33,274,640 | 69.7% |
One-third of production comes from two publicly-traded parent companies: Smith & Wesson (NASDAQ: SWBI), and Sturm, Ruger & Co. (NYSE: RGR)
Some of these players are especially dominant within certain types of firearms. For example:
- 58% of pistols were made by Smith & Wesson, Ruger, and SIG SAUER (2008–2018)
- 45% of rifles were made by Remington*, Ruger, and Smith & Wesson (2008–2018)
*In 2020, Remington filed for Chapter 11 bankruptcy protection, and its assets were divided and sold to various buyers. The Remington brand name is now owned by Vista Outdoor (NYSE: VSTO)
The Geography of Gun Manufacturing
Companies that manufacture guns hold a Type 07 license from the ATF. As of 2020, there are more than 16,000 Type 07 licensees across the United States.
Below is a state-level look at where the country’s licensees are located:
State | Licenses (2000) | Licenses (2020) | Population | Licenses per 100,000 pop. (2020) |
---|---|---|---|---|
Alaska | 8 | 117 | 733,391 | 16.0 |
Alabama | 40 | 276 | 5,039,877 | 5.5 |
Arkansas | 28 | 302 | 3,011,524 | 10.0 |
Arizona | 100 | 959 | 7,276,316 | 13.2 |
California | 159 | 620 | 39,237,836 | 1.6 |
Colorado | 27 | 481 | 5,812,069 | 8.3 |
Connecticut | 71 | 194 | 3,605,944 | 5.4 |
Delaware | 0 | 10 | 989,948 | 1.0 |
Florida | 131 | 1,009 | 21,781,128 | 4.6 |
Georgia | 52 | 510 | 10,799,566 | 4.7 |
Hawaii | 0 | 11 | 1,455,271 | 0.8 |
Iowa | 11 | 187 | 3,190,369 | 5.9 |
Idaho | 38 | 358 | 1,839,106 | 19.5 |
Illinois | 40 | 263 | 12,671,469 | 2.1 |
Indiana | 39 | 280 | 6,805,985 | 4.1 |
Kansas | 17 | 229 | 2,937,880 | 7.8 |
Kentucky | 22 | 211 | 4,505,836 | 4.7 |
Louisiana | 20 | 258 | 4,657,757 | 5.5 |
Massachusetts | 67 | 263 | 6,984,723 | 3.8 |
Maryland | 36 | 146 | 6,165,129 | 2.4 |
Maine | 13 | 107 | 1,362,359 | 7.9 |
Michigan | 43 | 386 | 10,050,811 | 3.8 |
Minnesota | 63 | 254 | 5,707,390 | 4.5 |
Missouri | 62 | 401 | 6,168,187 | 6.5 |
Mississippi | 12 | 190 | 2,961,279 | 6.4 |
Montana | 24 | 240 | 1,084,225 | 22.1 |
North Carolina | 52 | 628 | 10,551,162 | 6.0 |
North Dakota | 3 | 46 | 779,094 | 5.9 |
Nebraska | 15 | 91 | 1,961,504 | 4.6 |
New Hampshire | 25 | 188 | 1,377,529 | 13.6 |
New Jersey | 10 | 26 | 9,267,130 | 0.3 |
New Mexico | 18 | 179 | 2,117,522 | 8.5 |
Nevada | 45 | 276 | 3,104,614 | 8.9 |
New York | 35 | 299 | 19,835,913 | 1.5 |
Ohio | 80 | 644 | 11,780,017 | 5.5 |
Oklahoma | 37 | 423 | 3,959,353 | 10.7 |
Oregon | 55 | 226 | 4,237,256 | 5.3 |
Pennsylvania | 87 | 519 | 12,964,056 | 4.0 |
Rhode Island | 1 | 20 | 1,097,379 | 1.8 |
South Carolina | 25 | 284 | 5,190,705 | 5.5 |
South Dakota | 14 | 79 | 886,667 | 8.9 |
Tennessee | 76 | 352 | 6,975,218 | 5.0 |
Texas | 150 | 2,022 | 29,527,941 | 6.8 |
Utah | 33 | 478 | 3,271,616 | 14.6 |
Virginia | 48 | 412 | 8,642,274 | 4.8 |
Vermont | 15 | 85 | 643,077 | 13.2 |
Washington | 49 | 351 | 7,738,692 | 4.5 |
Wisconsin | 38 | 306 | 5,895,908 | 5.2 |
West Virginia | 20 | 115 | 1,793,716 | 6.4 |
Wyoming | 20 | 147 | 576,851 | 25.5 |
These manufacturers are located all around the country, so these numbers are somewhat reflective of population. Unsurprisingly, large states like Texas and Florida have the most licensees.
Sorting by the number of licensees per 100,000 people offers a different point of view. By this measure, Wyoming, Montana, and Idaho come out on top.
If recent sales and production trends are any indication, these numbers may only continue to grow.
Business
The World’s Largest Real Estate Investment Trusts (REITs)
Real estate investment trusts (REITS) are a simple alternative for investors looking to gain exposure to real estate.

The World’s Largest Real Estate Investment Trusts (REITs)
Real estate is widely regarded as an attractive asset class for investors.
This is because it offers several benefits like diversification (due to less correlation with stocks), monthly income, and protection from inflation. The latter is known as “inflation hedging”, and stems from real estate’s tendency to appreciate during periods of rising prices.
Affordability, of course, is a major barrier to investing in most real estate. Property markets around the world have reached bubble territory, making it incredibly difficult for people to get their foot in the door.
Thankfully, there are easier ways of gaining exposure. One of these is purchasing shares in a real estate investment trust (REIT), a type of company that owns and operates income-producing real estate, and is most often publicly-traded.
What Qualifies as REIT?
To qualify as a REIT in the U.S., a company must meet several criteria:
- Invest at least 75% of assets in real estate, cash , or U.S. Treasuries
- Derive at least 75% of gross income from rents, interest on mortgages, or real estate sales
- Pay at least 90% of taxable income in the form of shareholder dividends
- Be a taxable corporation
- Be managed by a board of directors or trustees
- Have at least 100 shareholders after one year of operations
- Have no more than half its shares held by five or fewer people
Investing in a REIT is similar to purchasing shares of any other publicly-traded company. There are also exchange-traded funds (ETFs) and mutual funds which may hold a basket of REITs. Lastly, note that some REITs are private, meaning they aren’t traded on stock exchanges.
The Top 10 by Market Cap
Here are the world’s 10 largest publicly-traded REITs, as of March 25, 2022.
REIT | Market Cap | Dividend Yield | Property Type |
---|---|---|---|
Prologis (NYSE: PLD) | $116.4B | 2.03% | Industrial |
American Tower (NYSE: AMT) | $109.8B | 2.38% | Communications |
Crown Castle (NYSE: CCI | $76.8B | 3.35% | Communications |
Public Storage (NYSE: PSA) | $65.9B | 2.14% | Self-storage |
Equinix (NYSE: EQIX) | $64.4B | 1.74% | Data centers |
Simon Property Group (NYSE: SPG) | $48.9B | 5.07% | Malls |
Welltower (NYSE: WELL) | $43.0B | 2.58% | Healthcare |
Digital Realty (NYSE: DLR) | $40.1B | 3.55% | Data centers |
Realty Income (NYSE: O) | $40.1B | 4.44% | Commercial |
AvalonBay Communities (NYSE: AVB) | $34.6B | 2.62% | Residential |
As shown above, REITs focus on different sectors of the market. Understanding their differences is an important step to consider before making an investment.
For example, Prologis manages the world’s largest portfolio of logistics real estate. This includes warehouses, distribution centers, and other supply chain facilities around the globe. It’s reasonable to assume that this REIT would benefit from further growth in ecommerce—more on this near the end.
Realty Income, on the other hand, owns a portfolio of over 11,100 commercial real estate properties in the U.S. and Europe. It rents these properties out to major brands like Walgreens and 7-Eleven, which together account for 8.1% of the REIT’s annual income.
More Than Just Buildings
Cell towers and data centers may not seem like “real estate”, but they are both critical pieces of modern infrastructure that take up land.
REITs that focus on these sectors include American Tower and Crown Castle, which own wireless communications assets in the U.S. and abroad. They are likely to benefit from the increased adoption of 5G networks and the Internet of Things (IoT).
On the other hand, Equinix and Digital Realty are focused on data centers, a fast growing industry that is benefitting from digitalization. Both of these REITs work with major tech firms such as Amazon and Google.
Trends to Watch
The demand for real estate can be heavily influenced by overarching trends found around the world. One of these is population growth and urbanization, which has drastically pushed up the cost of housing in many cities around the world.
There’s also the rising prevalence of ecommerce, which has triggered a boom in demand for warehouse space. This is best captured by Amazon’s massive growth during the COVID-19 pandemic, during which the company doubled the number of its warehouse facilities.
Globally, ecommerce accounts for just 19.6% of total retail sales. Should that figure continue to rise, industrial real estate prices could be in store for robust, long-term growth.
-
Money2 weeks ago
Mapping the Migration of the World’s Millionaires
-
Markets2 weeks ago
Visualizing the Coming Shift in Global Economic Power (2006-2036p)
-
Datastream3 weeks ago
Ranked: These Are 10 of the World’s Least Affordable Housing Markets
-
Demographics2 weeks ago
Mapped: A Decade of Population Growth and Decline in U.S. Counties
-
Misc3 weeks ago
Visualizing Well-Known Airlines by Fleet Composition
-
Misc2 weeks ago
Iconic Infographic Map Compares the World’s Mountains and Rivers
-
Energy2 days ago
Who’s Still Buying Fossil Fuels From Russia?
-
Markets6 days ago
Interest Rate Hikes vs. Inflation Rate, by Country