

The IMF has released its economic growth forecasts for 2024. How do the G7 and BRICS countries compare?


A sneak preview of the exclusive VC+ Special Dispatch—your shortcut to understanding IMF's World Economic Outlook report.


See how much the debt-to-GDP ratios of advanced economies have grown (or shrank) since the year 2000.


The top three economic powerhouses of Africa contribute more than one-third to the African economy. We rank the nations of the world's second-largest continent by 2024...


We round up the most popular, most discussed, and most liked visualizations of the month on Voronoi, our new data storytelling platform.
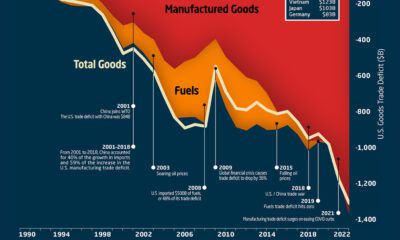

This graphic the U.S. trade deficit growth since 1990, and how manufactured goods and fuels factor in over the last three decades.
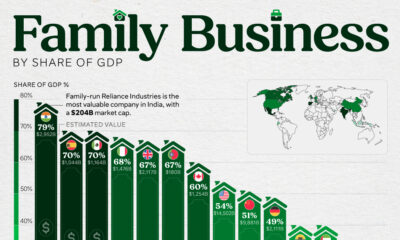

Family-owned businesses are key drivers of the global economy. This graphic shows their economic contribution to GDP, by country.


Services-producing industries account for the majority of U.S. GDP in 2023, followed by other private industries and the government.
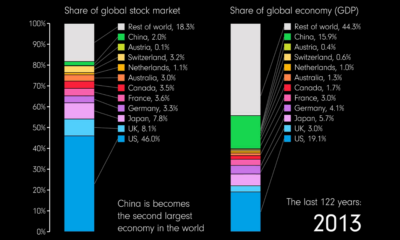

This animation compares countries' share of the global stock market and GDP over 122 years from 1900 to 2022.

This graphic uses the latest IMF projections to rank the world's top 20 fastest growing economies for 2024.


 Creator Program