Markets
Ranked: The Fastest Growing Economies In 2024
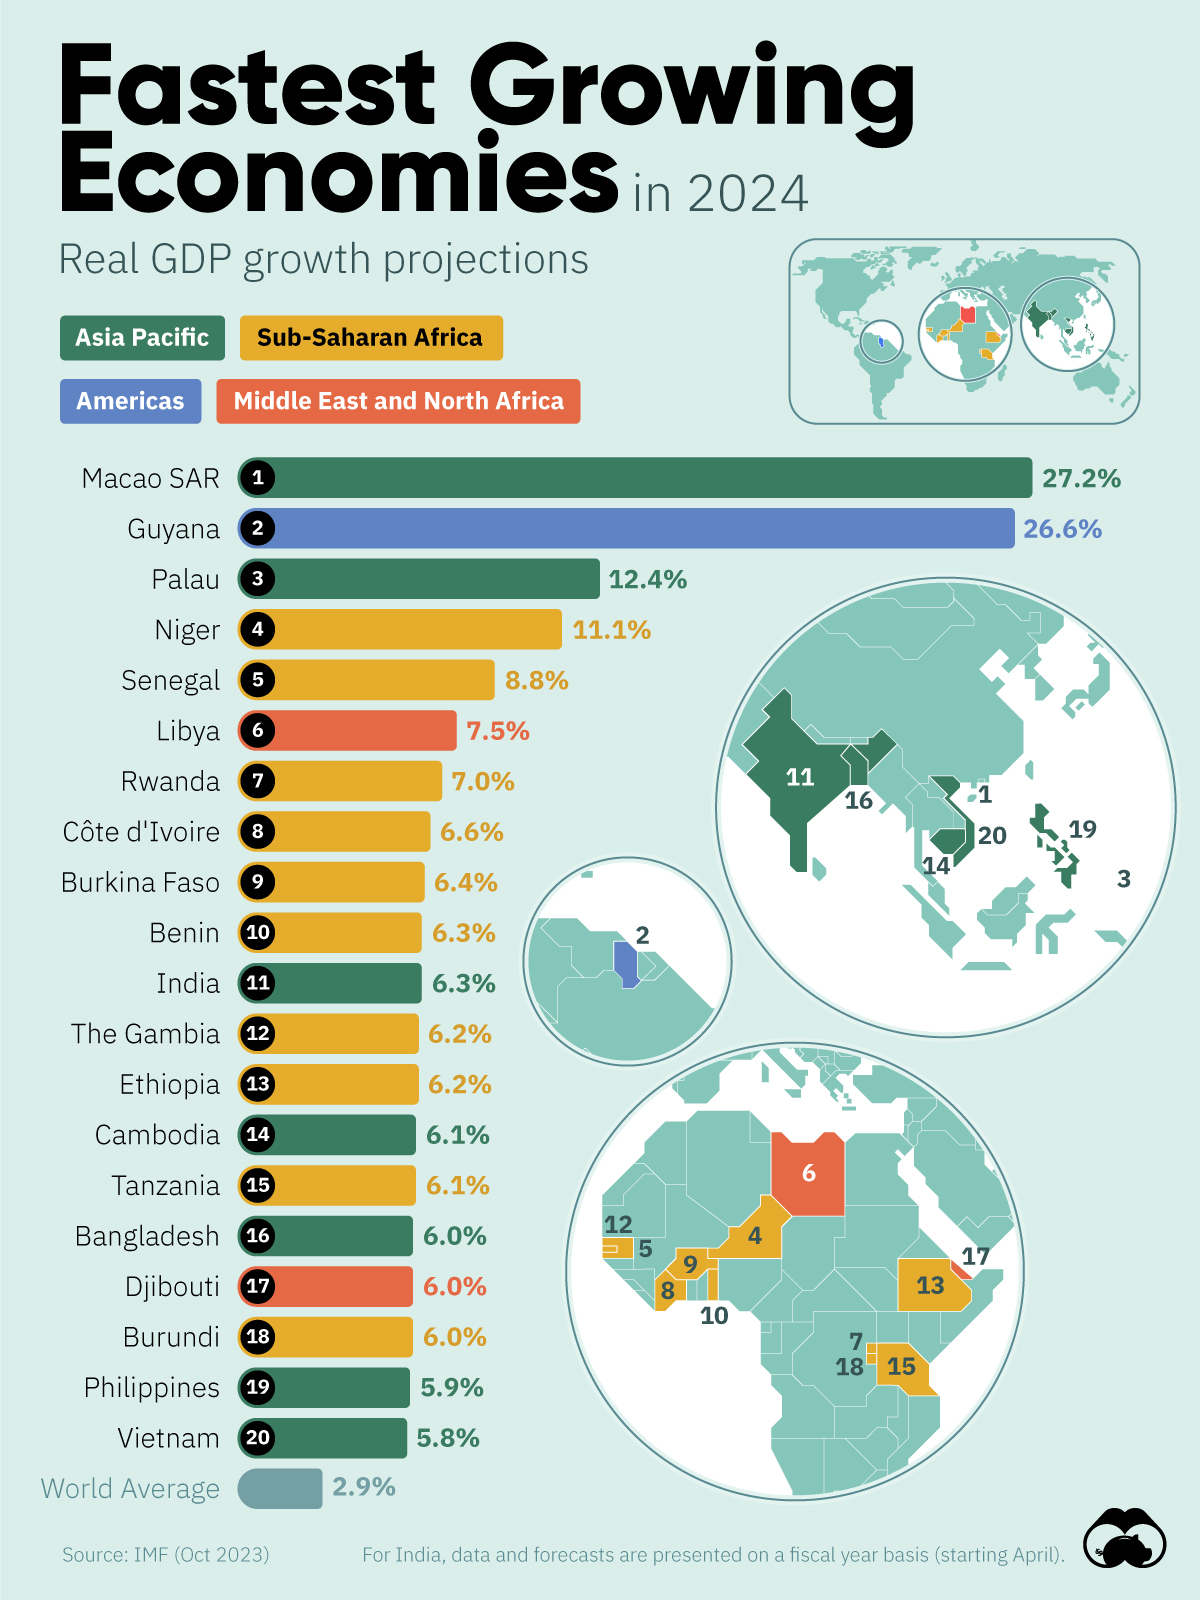
IMF Projections: The Fastest Growing Economies in 2024
Which countries will see the most economic growth in 2024?
To answer this question, we’ve visualized GDP growth forecasts from the IMF’s October 2023 World Economic Outlook. Unsurprisingly, many of these countries are located in Asia and Sub-Saharan Africa—two of the world’s fastest growing regions.
| Country | Region | GDP Growth 2024 (%) |
|---|---|---|
| 🇲🇴 Macao SAR | Asia Pacific | 27.2 |
| 🇬🇾 Guyana | Americas | 26.6 |
| 🇵🇼 Palau | Asia Pacific | 12.4 |
| 🇳🇪 Niger | Sub-Saharan Africa | 11.1 |
| 🇸🇳 Senegal | Sub-Saharan Africa | 8.8 |
| 🇱🇾 Libya | Middle East and North Africa | 7.5 |
| 🇷🇼 Rwanda | Sub-Saharan Africa | 7.0 |
| 🇨🇮 Côte d'Ivoire | Sub-Saharan Africa | 6.6 |
| 🇧🇫 Burkina Faso | Sub-Saharan Africa | 6.4 |
| 🇧🇯 Benin | Sub-Saharan Africa | 6.3 |
| 🇮🇳 India | Asia Pacific | 6.3 |
| 🇬🇲 The Gambia | Sub-Saharan Africa | 6.2 |
| 🇪🇹 Ethiopia | Sub-Saharan Africa | 6.2 |
| 🇰🇭 Cambodia | Asia Pacific | 6.1 |
| 🇹🇿 Tanzania | Sub-Saharan Africa | 6.1 |
| 🇧🇩 Bangladesh | Asia Pacific | 6.0 |
| 🇩🇯 Djibouti | Middle East and North Africa | 6.0 |
| 🇧🇮 Burundi | Sub-Saharan Africa | 6.0 |
| 🇵🇭 Philippines | Asia Pacific | 5.9 |
| 🇻🇳 Vietnam | Asia Pacific | 5.8 |
| 🌍 World Average | -- | 2.9 |
For India, data and forecasts are presented on a fiscal year basis (starting April). Continue reading below for additional context on these figures.
Highlights: Asia Pacific
The fastest growing economies in Asia are forecasted to be Macao (+27.2%), Palau (+12.4%), and India (+6.3%).
- The economy of Macao is heavily reliant on tourism, an industry that represents over 60% of the region’s jobs, as well as roughly 70% of its GDP.
- Palau is a tiny country consisting of 340 islands, representing an overall land area of 180 square miles (466 square kilometers). According to the U.S. State Department, tourism represents approximately 40% of Palau’s GDP.
- India, which recently became the world’s largest country by population, is expected to reach a peak of 1.7 billion people by 2064.
Highlights: Sub-Saharan Africa
Sub-Saharan Africa accounts for half of the top 20 list, with Niger (+11.1%) and Senegal (+8.8%) leading.
- A recent military coup could have serious implications on Niger’s future economic growth. The country’s Agadem oil field, which is majority owned by China National Petroleum Corporation (CNPC), could see its exports disrupted as a result of global sanctions.
- Senegal’s economy is also linked to the oil industry, meaning its growth could fluctuate in the years to come.
Oil Drives Growth for Guyana
Guyana (+26.6%), with a population of only 815,000, is expected to be the second fastest growing economy in 2024. Interestingly, it was the world’s fastest growing economy last year, with a 62% increase in GDP, and is likely to claim that title again in 2023 with expected growth of 37%.
This growth is largely driven by rising oil exports from Stabroek Block, an offshore oil field being developed by an Exxon Mobil-led consortium. According to BBC, Guyana has over 11 billion barrels in oil reserves.


Markets
The European Stock Market: Attractive Valuations Offer Opportunities
On average, the European stock market has valuations that are nearly 50% lower than U.S. valuations. But how can you access the market?


European Stock Market: Attractive Valuations Offer Opportunities
Europe is known for some established brands, from L’Oréal to Louis Vuitton. However, the European stock market offers additional opportunities that may be lesser known.
The above infographic, sponsored by STOXX, outlines why investors may want to consider European stocks.
Attractive Valuations
Compared to most North American and Asian markets, European stocks offer lower or comparable valuations.
| Index | Price-to-Earnings Ratio | Price-to-Book Ratio |
|---|---|---|
| EURO STOXX 50 | 14.9 | 2.2 |
| STOXX Europe 600 | 14.4 | 2 |
| U.S. | 25.9 | 4.7 |
| Canada | 16.1 | 1.8 |
| Japan | 15.4 | 1.6 |
| Asia Pacific ex. China | 17.1 | 1.8 |
Data as of February 29, 2024. See graphic for full index names. Ratios based on trailing 12 month financials. The price to earnings ratio excludes companies with negative earnings.
On average, European valuations are nearly 50% lower than U.S. valuations, potentially offering an affordable entry point for investors.
Research also shows that lower price ratios have historically led to higher long-term returns.
Market Movements Not Closely Connected
Over the last decade, the European stock market had low-to-moderate correlation with North American and Asian equities.
The below chart shows correlations from February 2014 to February 2024. A value closer to zero indicates low correlation, while a value of one would indicate that two regions are moving in perfect unison.
| EURO STOXX 50 | STOXX EUROPE 600 | U.S. | Canada | Japan | Asia Pacific ex. China |
|
|---|---|---|---|---|---|---|
| EURO STOXX 50 | 1.00 | 0.97 | 0.55 | 0.67 | 0.24 | 0.43 |
| STOXX EUROPE 600 | 1.00 | 0.56 | 0.71 | 0.28 | 0.48 | |
| U.S. | 1.00 | 0.73 | 0.12 | 0.25 | ||
| Canada | 1.00 | 0.22 | 0.40 | |||
| Japan | 1.00 | 0.88 | ||||
| Asia Pacific ex. China | 1.00 |
Data is based on daily USD returns.
European equities had relatively independent market movements from North American and Asian markets. One contributing factor could be the differing sector weights in each market. For instance, technology makes up a quarter of the U.S. market, but health care and industrials dominate the broader European market.
Ultimately, European equities can enhance portfolio diversification and have the potential to mitigate risk for investors.
Tracking the Market
For investors interested in European equities, STOXX offers a variety of flagship indices:
| Index | Description | Market Cap |
|---|---|---|
| STOXX Europe 600 | Pan-regional, broad market | €10.5T |
| STOXX Developed Europe | Pan-regional, broad-market | €9.9T |
| STOXX Europe 600 ESG-X | Pan-regional, broad market, sustainability focus | €9.7T |
| STOXX Europe 50 | Pan-regional, blue-chip | €5.1T |
| EURO STOXX 50 | Eurozone, blue-chip | €3.5T |
Data is as of February 29, 2024. Market cap is free float, which represents the shares that are readily available for public trading on stock exchanges.
The EURO STOXX 50 tracks the Eurozone’s biggest and most traded companies. It also underlies one of the world’s largest ranges of ETFs and mutual funds. As of November 2023, there were €27.3 billion in ETFs and €23.5B in mutual fund assets under management tracking the index.
“For the past 25 years, the EURO STOXX 50 has served as an accurate, reliable and tradable representation of the Eurozone equity market.”
— Axel Lomholt, General Manager at STOXX
Partnering with STOXX to Track the European Stock Market
Are you interested in European equities? STOXX can be a valuable partner:
- Comprehensive, liquid and investable ecosystem
- European heritage, global reach
- Highly sophisticated customization capabilities
- Open architecture approach to using data
- Close partnerships with clients
- Part of ISS STOXX and Deutsche Börse Group
With a full suite of indices, STOXX can help you benchmark against the European stock market.
Learn how STOXX’s European indices offer liquid and effective market access.

-

 Economy2 days ago
Economic Growth Forecasts for G7 and BRICS Countries in 2024
The IMF has released its economic growth forecasts for 2024. How do the G7 and BRICS countries compare?
-

 Markets1 week ago
U.S. Debt Interest Payments Reach $1 Trillion
U.S. debt interest payments have surged past the $1 trillion dollar mark, amid high interest rates and an ever-expanding debt burden.
-

 United States2 weeks ago
Ranked: The Largest U.S. Corporations by Number of Employees
We visualized the top U.S. companies by employees, revealing the massive scale of retailers like Walmart, Target, and Home Depot.
-

 Markets2 weeks ago
The Top 10 States by Real GDP Growth in 2023
This graphic shows the states with the highest real GDP growth rate in 2023, largely propelled by the oil and gas boom.
-

 Markets2 weeks ago
Ranked: The World’s Top Flight Routes, by Revenue
In this graphic, we show the highest earning flight routes globally as air travel continued to rebound in 2023.
-

 Markets2 weeks ago
Ranked: The Most Valuable Housing Markets in America
The U.S. residential real estate market is worth a staggering $47.5 trillion. Here are the most valuable housing markets in the country.


-

 Misc1 week ago
How Hard Is It to Get Into an Ivy League School?
-

 Technology2 weeks ago
Ranked: Semiconductor Companies by Industry Revenue Share
-
Markets2 weeks ago
Ranked: The World’s Top Flight Routes, by Revenue
-

 Countries2 weeks ago
Population Projections: The World’s 6 Largest Countries in 2075
-
Markets2 weeks ago
The Top 10 States by Real GDP Growth in 2023
-

 Demographics2 weeks ago
The Smallest Gender Wage Gaps in OECD Countries
-

 United States2 weeks ago
Where U.S. Inflation Hit the Hardest in March 2024
-

 Environment2 weeks ago
Top Countries By Forest Growth Since 2001