Markets
Charted: The Key Investment Theme of Each Decade (1950-Today)
Subscribe to the Advisor Channel free mailing list for more like this
Visualizing the Key Investment Theme of Each Decade
This was originally posted on Advisor Channel. Sign up to the free mailing list to get beautiful visualizations on financial markets that help advisors and their clients.
Over modern history, a key investment theme has broadly characterized each decade.
In each case, a particular asset class, sector, or region captivated investors for an extended period, driving returns and outperforming the rest of the market.
This graphic shows 70 years of key investment themes, based on analysis from Ruchir Sharma of Morgan Stanley Investment Management via NS Capital.
Investment Themes by Decade
These decade-defining themes are often the product of a confluence of factors, including the macroeconomic environment, geopolitics, monetary policy, or other structural shifts like technological disruption.
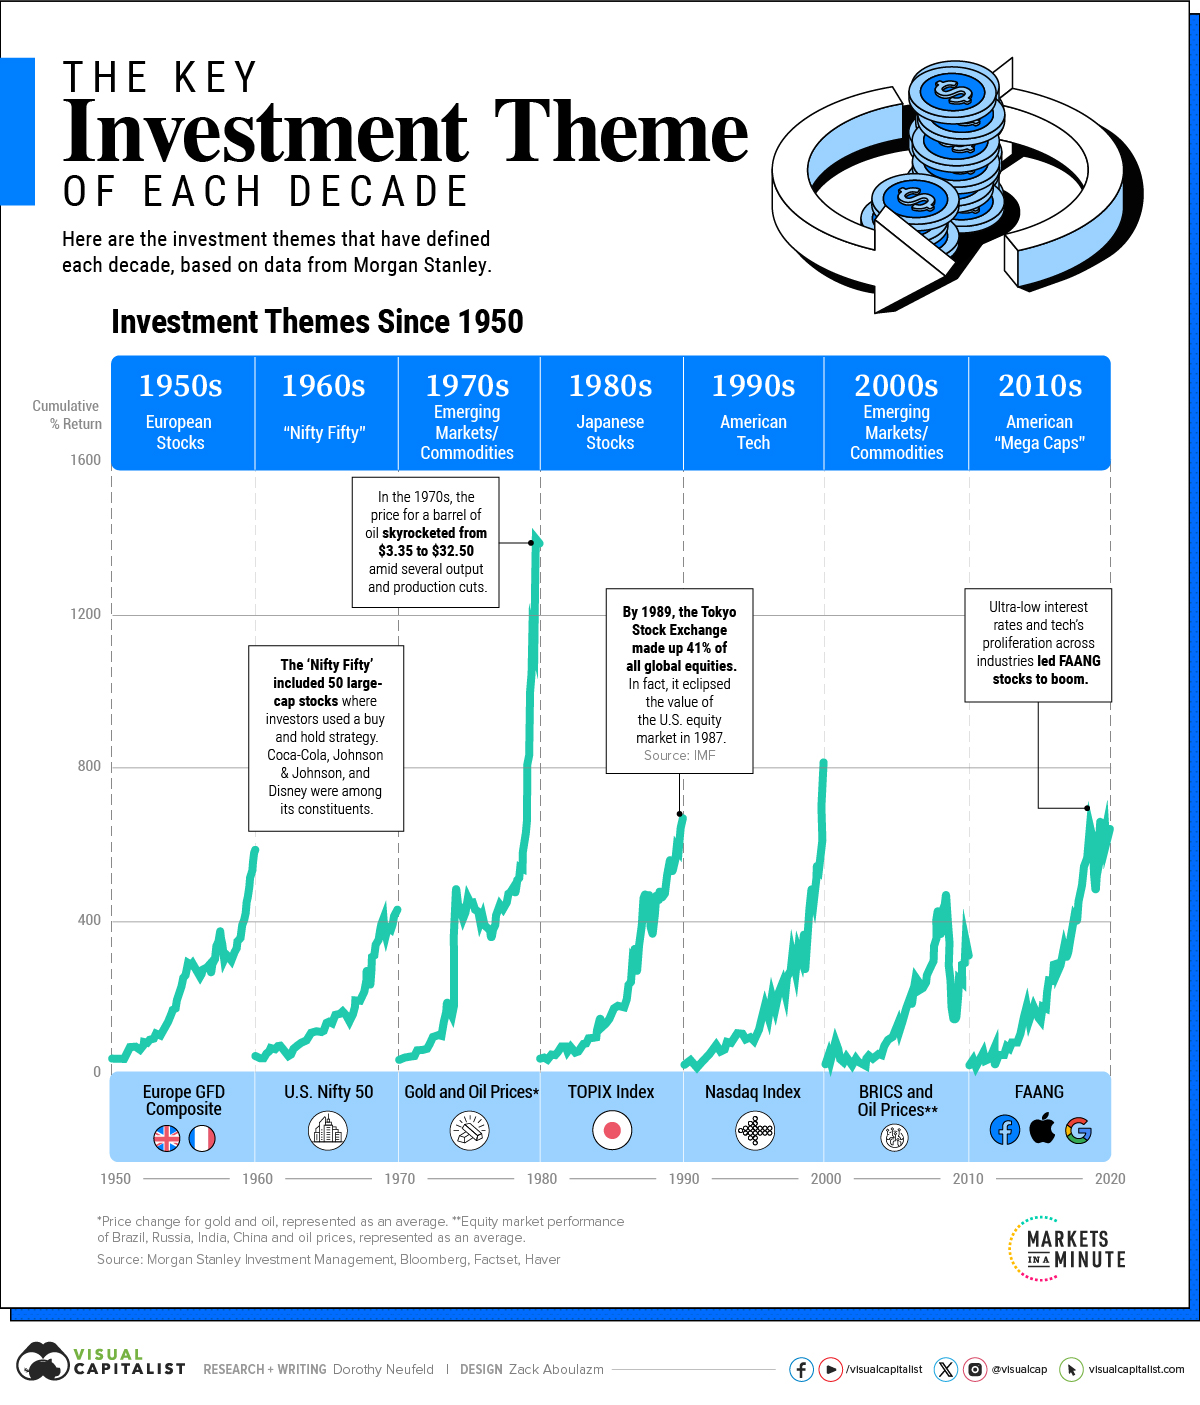
Here are the central investment themes since the 1950s, each with at least 400% cumulative returns over each period:
| Decade | Investment Theme | Index / Asset |
|---|---|---|
| 1950s | European Stocks | Europe GFD Composite |
| 1960s | “Nifty Fifty” | U.S. Nifty 50 |
| 1970s | Emerging Markets/ Commodities | Gold and Oil Prices* |
| 1980s | Japanese Stocks | TOPIX Index |
| 1990s | American Tech | Nasdaq Index |
| 2000s | Emerging Markets/ Commodities | BRICs and Oil Prices** |
| 2010s | American “Mega Caps” | FAANG |
*Price change for gold and oil, represented as an average. **Equity market performance of Brazil, Russia, India, China and oil prices, represented as an average.
The 1950s saw a boom in European stocks during the post-war recovery. This was fueled by significant investment from corporations and governments as Europe became more integrated.
Then in the 1960s, investors poured into blue chip stocks in the “Nifty Fifty” including Johnson & Johnson, Disney, and Coca-Cola. The main premise was that these strong franchises would deliver high returns over the long run. During the 1973-1974 bear market, shares cratered.
As oil skyrocketed from $3.35 to $32.50 through the 1970s amid production and output cuts, commodities dominated, along with emerging economy exporters of oil and gold.
Later, through the 1980s, Japanese stocks dramatically increased. In 1989, the Tokyo Stock Exchange made up 41% of all global equities. It had eclipsed the value of the U.S. equity market just two years earlier.
In part owing to strong U.S. economic growth, American tech stocks flourished through the 1990s. While many high-flying tech stocks were wiped out during the crash in 2000, some still remain today. Qualcomm, which jumped 2,620% in 1999, is a multi-billion dollar semiconductor company. Amazon and Cisco were other survivors of this era.
Pivoting from growth assets, investors returned to commodities and emerging markets over the 2000s, this time with BRIC economies—Brazil, Russia, India, and China. The 2010s saw the rise of FAANG stocks as tech proliferated across countless industries.
The Next Decade Ahead
Given how each decade seems to be defined by a key investment theme, Sharma suggests that it won’t be another driven defined by American stocks.
The disconnect between the size of U.S. equity markets, at 43% of the global share, and its economic output, which is 26% of the world’s total, is one reason driving a new shift.
Another factor is stark differences in valuations. Today, the U.S. stock market compared to the rest of the world is at its highest relative level in 100 years, suggesting it is overvalued and primed for a shift.
Whether global stocks gain a greater global equity market share—to become a key investment cycle of this decade—remains an open question.


Markets
The European Stock Market: Attractive Valuations Offer Opportunities
On average, the European stock market has valuations that are nearly 50% lower than U.S. valuations. But how can you access the market?


European Stock Market: Attractive Valuations Offer Opportunities
Europe is known for some established brands, from L’Oréal to Louis Vuitton. However, the European stock market offers additional opportunities that may be lesser known.
The above infographic, sponsored by STOXX, outlines why investors may want to consider European stocks.
Attractive Valuations
Compared to most North American and Asian markets, European stocks offer lower or comparable valuations.
| Index | Price-to-Earnings Ratio | Price-to-Book Ratio |
|---|---|---|
| EURO STOXX 50 | 14.9 | 2.2 |
| STOXX Europe 600 | 14.4 | 2 |
| U.S. | 25.9 | 4.7 |
| Canada | 16.1 | 1.8 |
| Japan | 15.4 | 1.6 |
| Asia Pacific ex. China | 17.1 | 1.8 |
Data as of February 29, 2024. See graphic for full index names. Ratios based on trailing 12 month financials. The price to earnings ratio excludes companies with negative earnings.
On average, European valuations are nearly 50% lower than U.S. valuations, potentially offering an affordable entry point for investors.
Research also shows that lower price ratios have historically led to higher long-term returns.
Market Movements Not Closely Connected
Over the last decade, the European stock market had low-to-moderate correlation with North American and Asian equities.
The below chart shows correlations from February 2014 to February 2024. A value closer to zero indicates low correlation, while a value of one would indicate that two regions are moving in perfect unison.
| EURO STOXX 50 | STOXX EUROPE 600 | U.S. | Canada | Japan | Asia Pacific ex. China |
|
|---|---|---|---|---|---|---|
| EURO STOXX 50 | 1.00 | 0.97 | 0.55 | 0.67 | 0.24 | 0.43 |
| STOXX EUROPE 600 | 1.00 | 0.56 | 0.71 | 0.28 | 0.48 | |
| U.S. | 1.00 | 0.73 | 0.12 | 0.25 | ||
| Canada | 1.00 | 0.22 | 0.40 | |||
| Japan | 1.00 | 0.88 | ||||
| Asia Pacific ex. China | 1.00 |
Data is based on daily USD returns.
European equities had relatively independent market movements from North American and Asian markets. One contributing factor could be the differing sector weights in each market. For instance, technology makes up a quarter of the U.S. market, but health care and industrials dominate the broader European market.
Ultimately, European equities can enhance portfolio diversification and have the potential to mitigate risk for investors.
Tracking the Market
For investors interested in European equities, STOXX offers a variety of flagship indices:
| Index | Description | Market Cap |
|---|---|---|
| STOXX Europe 600 | Pan-regional, broad market | €10.5T |
| STOXX Developed Europe | Pan-regional, broad-market | €9.9T |
| STOXX Europe 600 ESG-X | Pan-regional, broad market, sustainability focus | €9.7T |
| STOXX Europe 50 | Pan-regional, blue-chip | €5.1T |
| EURO STOXX 50 | Eurozone, blue-chip | €3.5T |
Data is as of February 29, 2024. Market cap is free float, which represents the shares that are readily available for public trading on stock exchanges.
The EURO STOXX 50 tracks the Eurozone’s biggest and most traded companies. It also underlies one of the world’s largest ranges of ETFs and mutual funds. As of November 2023, there were €27.3 billion in ETFs and €23.5B in mutual fund assets under management tracking the index.
“For the past 25 years, the EURO STOXX 50 has served as an accurate, reliable and tradable representation of the Eurozone equity market.”
— Axel Lomholt, General Manager at STOXX
Partnering with STOXX to Track the European Stock Market
Are you interested in European equities? STOXX can be a valuable partner:
- Comprehensive, liquid and investable ecosystem
- European heritage, global reach
- Highly sophisticated customization capabilities
- Open architecture approach to using data
- Close partnerships with clients
- Part of ISS STOXX and Deutsche Börse Group
With a full suite of indices, STOXX can help you benchmark against the European stock market.
Learn how STOXX’s European indices offer liquid and effective market access.

-

 Economy2 days ago
Economic Growth Forecasts for G7 and BRICS Countries in 2024
The IMF has released its economic growth forecasts for 2024. How do the G7 and BRICS countries compare?
-

 Markets1 week ago
U.S. Debt Interest Payments Reach $1 Trillion
U.S. debt interest payments have surged past the $1 trillion dollar mark, amid high interest rates and an ever-expanding debt burden.
-

 United States2 weeks ago
Ranked: The Largest U.S. Corporations by Number of Employees
We visualized the top U.S. companies by employees, revealing the massive scale of retailers like Walmart, Target, and Home Depot.
-

 Markets2 weeks ago
The Top 10 States by Real GDP Growth in 2023
This graphic shows the states with the highest real GDP growth rate in 2023, largely propelled by the oil and gas boom.
-

 Markets2 weeks ago
Ranked: The World’s Top Flight Routes, by Revenue
In this graphic, we show the highest earning flight routes globally as air travel continued to rebound in 2023.
-

 Markets3 weeks ago
Ranked: The Most Valuable Housing Markets in America
The U.S. residential real estate market is worth a staggering $47.5 trillion. Here are the most valuable housing markets in the country.


-

 Education1 week ago
How Hard Is It to Get Into an Ivy League School?
-

 Technology2 weeks ago
Ranked: Semiconductor Companies by Industry Revenue Share
-
Markets2 weeks ago
Ranked: The World’s Top Flight Routes, by Revenue
-

 Demographics2 weeks ago
Population Projections: The World’s 6 Largest Countries in 2075
-
Markets2 weeks ago
The Top 10 States by Real GDP Growth in 2023
-

 Demographics2 weeks ago
The Smallest Gender Wage Gaps in OECD Countries
-

 Economy2 weeks ago
Where U.S. Inflation Hit the Hardest in March 2024
-

 Green2 weeks ago
Top Countries By Forest Growth Since 2001