Markets
The Top Performing Investment Themes of 2023
![]() See this visualization first on the Voronoi app.
See this visualization first on the Voronoi app.
The Top Performing Investment Themes of 2023
This was originally posted on Advisor Channel. Sign up to the free mailing list to get beautiful visualizations on financial markets that help advisors and their clients.
While the S&P 500 rebounded over 24% in 2023, many investment themes soared even higher.
In many ways, the year was defined by breakthrough announcements in AI and the resurgence of Bitcoin. At the same time, investors looked to nuclear energy ETFs thanks to nuclear’s growing role as a low carbon energy source and the war in Ukraine.
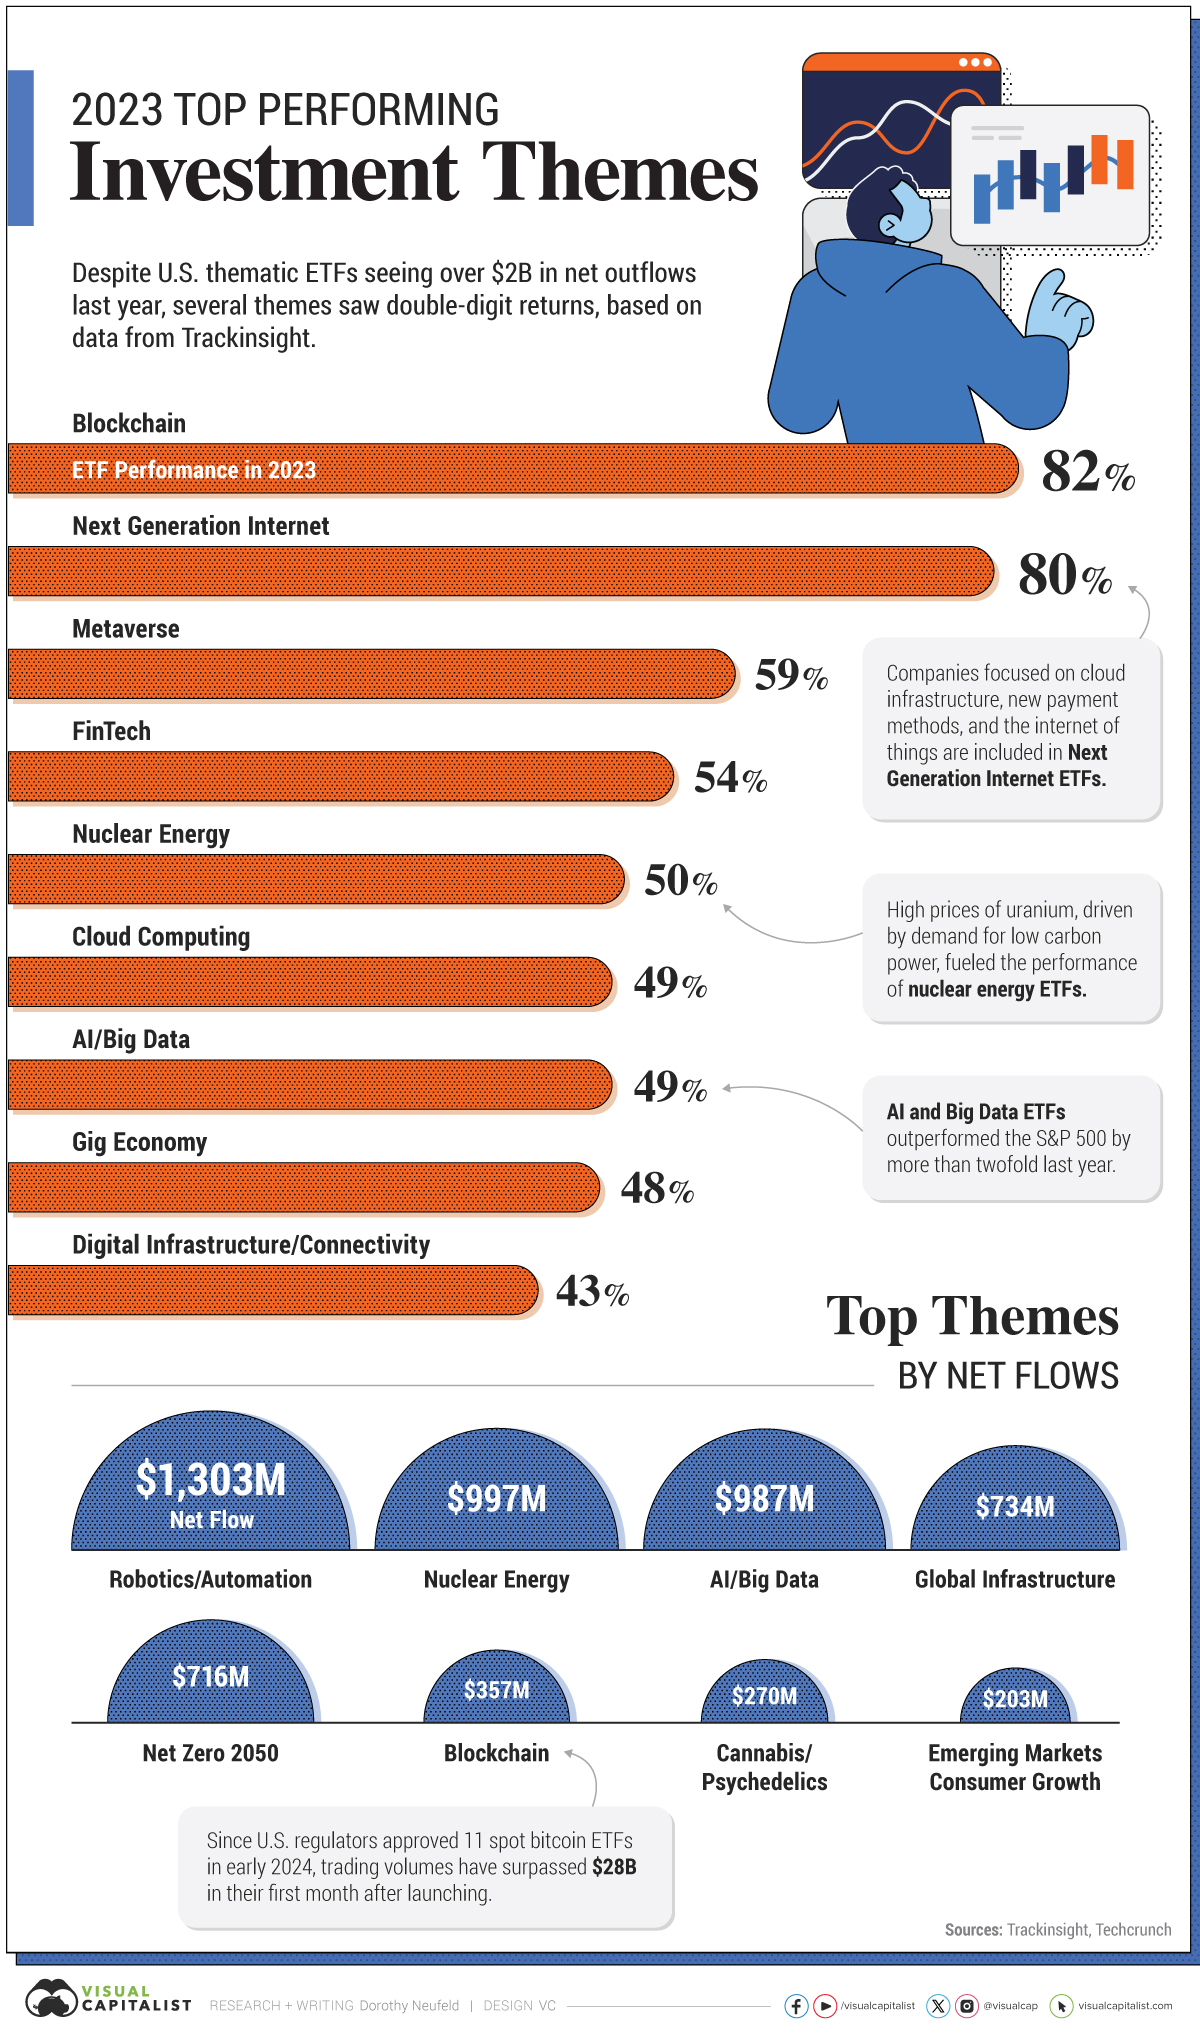
This graphic shows the best performing investment themes last year, based on data from Trackinsight.
Blockchain ETFs Lead the Pack
With 82% returns, blockchain ETFs outperformed all other themes in the U.S. due to the sharp rise in the bitcoin price over the year.
These ETFs hold mainly bitcoin mining firms, since ETFs investing directly in bitcoin were not yet approved by regulators in 2023. However, as of January 2024, U.S. regulators have approved 11 spot bitcoin ETFs for trading, which drew in $10 billion in assets in their first 20 days alone.
Below, we show the top performing themes across U.S. ETFs in 2023:
| Theme | 2023 Performance |
|---|---|
| Blockchain | 82% |
| Next Generation Internet | 80% |
| Metaverse | 59% |
| FinTech | 54% |
| Nuclear Energy | 50% |
| Cloud Computing | 49% |
| AI/Big Data | 49% |
| Gig Economy | 48% |
| Digital Infrastructure & Connectivity | 43% |
As we can see, next generation internet ETFs—which include companies focused on the internet of things and new payment methods—also boomed.
Meanwhile, nuclear energy ETFs had a banner year as uranium prices hit 15-year highs. Investor optimism for nuclear power is part of a wider trend of reactivating nuclear power plants globally in the push towards decarbonizing the energy supply. In fact, 63 new reactors across countries including Japan, Türkiye, and China are planned for construction amid higher global demand.
With 49% returns, AI and big data ETFs were another top performing investment theme. Driving these returns were companies like chipmaker Nvidia, whose share price jumped by 239% in 2023 thanks to its technology being fundamental to powering AI models.
Top Investment Themes, by Net Flows
Here are the the investment themes that saw the highest net flows over the year:
| Theme | 2023 Net Flows |
|---|---|
| Robotics & Automation | $1,303M |
| Nuclear Energy | $997M |
| AI/Big Data | $987M |
| Global Infrastructure | $734M |
| Net Zero 2050 | $716M |
| Blockchain | $357M |
| Cannabis & Psychedelics | $270M |
| Emerging Markets Consumer Growth | $203M |
Overall, ETFs focused on robotics and automation saw the greatest net flows amid wider deployment of these technologies across factories, healthcare, and transportation actvities.
The success of AI large language models over the year is another key factor in powering robotics capabilities. For instance, Microsoft is planning to build a robot powered by ChatGPT that provides it with higher context awareness of certain tasks.
Like robotics and automation, AI and big data, along with blockchain ETFs attracted high inflows.
Interestingly, ETFs surrounding emerging markets consumer growth saw strong inflows thanks to an expanding middle class across countries like India and China spurring potential growth opportunities. In 2024, 113 million people are projected to join the global middle class, seen mainly across countries in Asia.
Will Current Trends Continue in 2024?
So far, many of these investment themes have continued to see positive momentum including blockchain and next generation internet ETFs.
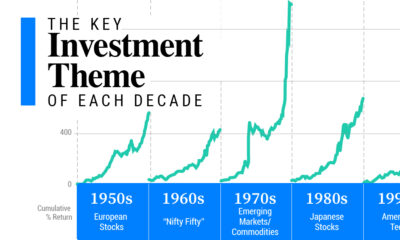
In many cases, these investment themes cover broad, underlying trends that have the potential to reshape sectors and industries. Going further, select investment themes have often defined each decade thanks to factors like technological disruption, geopolitics, and the economic environment.
While several factors could impact their performance—such as a global downturn or a second wave of inflation—it remains to be seen if investor demand will carry through the year and beyond.


Markets
The European Stock Market: Attractive Valuations Offer Opportunities
On average, the European stock market has valuations that are nearly 50% lower than U.S. valuations. But how can you access the market?


European Stock Market: Attractive Valuations Offer Opportunities
Europe is known for some established brands, from L’Oréal to Louis Vuitton. However, the European stock market offers additional opportunities that may be lesser known.
The above infographic, sponsored by STOXX, outlines why investors may want to consider European stocks.
Attractive Valuations
Compared to most North American and Asian markets, European stocks offer lower or comparable valuations.
| Index | Price-to-Earnings Ratio | Price-to-Book Ratio |
|---|---|---|
| EURO STOXX 50 | 14.9 | 2.2 |
| STOXX Europe 600 | 14.4 | 2 |
| U.S. | 25.9 | 4.7 |
| Canada | 16.1 | 1.8 |
| Japan | 15.4 | 1.6 |
| Asia Pacific ex. China | 17.1 | 1.8 |
Data as of February 29, 2024. See graphic for full index names. Ratios based on trailing 12 month financials. The price to earnings ratio excludes companies with negative earnings.
On average, European valuations are nearly 50% lower than U.S. valuations, potentially offering an affordable entry point for investors.
Research also shows that lower price ratios have historically led to higher long-term returns.
Market Movements Not Closely Connected
Over the last decade, the European stock market had low-to-moderate correlation with North American and Asian equities.
The below chart shows correlations from February 2014 to February 2024. A value closer to zero indicates low correlation, while a value of one would indicate that two regions are moving in perfect unison.
| EURO STOXX 50 | STOXX EUROPE 600 | U.S. | Canada | Japan | Asia Pacific ex. China |
|
|---|---|---|---|---|---|---|
| EURO STOXX 50 | 1.00 | 0.97 | 0.55 | 0.67 | 0.24 | 0.43 |
| STOXX EUROPE 600 | 1.00 | 0.56 | 0.71 | 0.28 | 0.48 | |
| U.S. | 1.00 | 0.73 | 0.12 | 0.25 | ||
| Canada | 1.00 | 0.22 | 0.40 | |||
| Japan | 1.00 | 0.88 | ||||
| Asia Pacific ex. China | 1.00 |
Data is based on daily USD returns.
European equities had relatively independent market movements from North American and Asian markets. One contributing factor could be the differing sector weights in each market. For instance, technology makes up a quarter of the U.S. market, but health care and industrials dominate the broader European market.
Ultimately, European equities can enhance portfolio diversification and have the potential to mitigate risk for investors.
Tracking the Market
For investors interested in European equities, STOXX offers a variety of flagship indices:
| Index | Description | Market Cap |
|---|---|---|
| STOXX Europe 600 | Pan-regional, broad market | €10.5T |
| STOXX Developed Europe | Pan-regional, broad-market | €9.9T |
| STOXX Europe 600 ESG-X | Pan-regional, broad market, sustainability focus | €9.7T |
| STOXX Europe 50 | Pan-regional, blue-chip | €5.1T |
| EURO STOXX 50 | Eurozone, blue-chip | €3.5T |
Data is as of February 29, 2024. Market cap is free float, which represents the shares that are readily available for public trading on stock exchanges.
The EURO STOXX 50 tracks the Eurozone’s biggest and most traded companies. It also underlies one of the world’s largest ranges of ETFs and mutual funds. As of November 2023, there were €27.3 billion in ETFs and €23.5B in mutual fund assets under management tracking the index.
“For the past 25 years, the EURO STOXX 50 has served as an accurate, reliable and tradable representation of the Eurozone equity market.”
— Axel Lomholt, General Manager at STOXX
Partnering with STOXX to Track the European Stock Market
Are you interested in European equities? STOXX can be a valuable partner:
- Comprehensive, liquid and investable ecosystem
- European heritage, global reach
- Highly sophisticated customization capabilities
- Open architecture approach to using data
- Close partnerships with clients
- Part of ISS STOXX and Deutsche Börse Group
With a full suite of indices, STOXX can help you benchmark against the European stock market.
Learn how STOXX’s European indices offer liquid and effective market access.

-

 Economy2 days ago
Economic Growth Forecasts for G7 and BRICS Countries in 2024
The IMF has released its economic growth forecasts for 2024. How do the G7 and BRICS countries compare?
-

 Markets1 week ago
U.S. Debt Interest Payments Reach $1 Trillion
U.S. debt interest payments have surged past the $1 trillion dollar mark, amid high interest rates and an ever-expanding debt burden.
-

 United States2 weeks ago
Ranked: The Largest U.S. Corporations by Number of Employees
We visualized the top U.S. companies by employees, revealing the massive scale of retailers like Walmart, Target, and Home Depot.
-

 Markets2 weeks ago
The Top 10 States by Real GDP Growth in 2023
This graphic shows the states with the highest real GDP growth rate in 2023, largely propelled by the oil and gas boom.
-

 Markets2 weeks ago
Ranked: The World’s Top Flight Routes, by Revenue
In this graphic, we show the highest earning flight routes globally as air travel continued to rebound in 2023.
-

 Markets2 weeks ago
Ranked: The Most Valuable Housing Markets in America
The U.S. residential real estate market is worth a staggering $47.5 trillion. Here are the most valuable housing markets in the country.


-

 Education1 week ago
How Hard Is It to Get Into an Ivy League School?
-

 Technology2 weeks ago
Ranked: Semiconductor Companies by Industry Revenue Share
-
Markets2 weeks ago
Ranked: The World’s Top Flight Routes, by Revenue
-

 Demographics2 weeks ago
Population Projections: The World’s 6 Largest Countries in 2075
-
Markets2 weeks ago
The Top 10 States by Real GDP Growth in 2023
-

 Demographics2 weeks ago
The Smallest Gender Wage Gaps in OECD Countries
-

 Economy2 weeks ago
Where U.S. Inflation Hit the Hardest in March 2024
-

 Environment2 weeks ago
Top Countries By Forest Growth Since 2001