

Indonesia, the region’s largest economy, makes the top five in this map exploring Southeast Asia’s GDP per capita levels.


Examining how people get around using cars, public transit, and walking or biking, and the regional differences in usage.
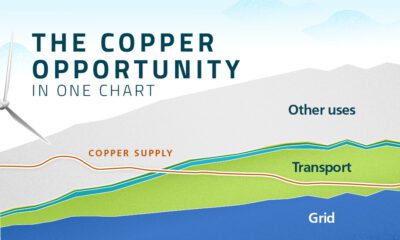

This infographic from Sprott shows how early investors may benefit from the rapidly increasing demand for copper.


Tax burden measures the percent of an individual's income that is paid towards taxes. See where it's the highest by state in this graphic.


This infographic shows estimated aluminum smelter production by country in 2023, based on data from the USGS.


While the U.S. is a major market for cryptocurrencies, two countries surpass it in terms of their rates of crypto ownership.


A survey during peak tax filing season reveals two big complaints that Americans have with the federal tax system.


Which European economies are richest on a GDP per capita basis? This map shows the results for 44 countries across the continent.


In this graphic, we've visualized stock market growth by country over the past five years using major indices.


This map shows life expectancy at birth for key global regions, from 1950 to 2050F.


