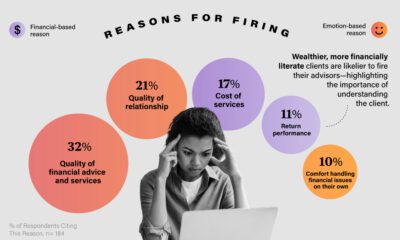

Firing an advisor is often driven by more than cost and performance factors. Here are the top reasons clients 'break up' with their advisors.
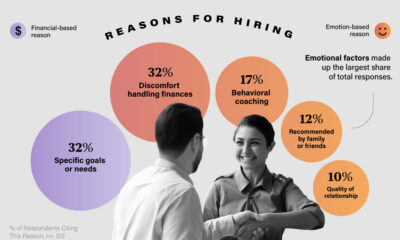

Here are the most common drivers for hiring a financial advisor, revealing that investor motivations go beyond just financial factors.


We visualized product categories that saw the highest % increase in price due to U.S. inflation as of March 2024.


Which OECD countries have the smallest gender wage gaps? We look at the 10 countries with gaps lower than the average.


This graphic shows the states with the highest real GDP growth rate in 2023, largely propelled by the oil and gas boom.


See how the world's 6 largest countries will grow (or shrink) by 2075, based on the latest UN population projections.


In this graphic, we show the highest earning flight routes globally as air travel continued to rebound in 2023.


Nvidia is coming for Intel’s crown. Samsung is losing ground. AI is transforming the space. We break down revenue for semiconductor companies.


Here's where workers earn the highest minimum wage in America as 22 states implement wage increases in 2024.


The U.S. residential real estate market is worth a staggering $47.5 trillion. Here are the most valuable housing markets in the country.


