

Asia dominates this ranking of the world's largest EV battery manufacturers in 2023.


From complete overhauls to more subtle tweaks, these tech logos have had quite a journey. Featuring: Google, Apple, and more.
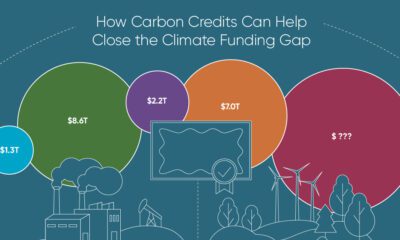

To keep a 1.5℃ world within reach, global emissions need to fall by as much as 45% by 2030, and carbon credits could help close the...


While smaller animals such as weasels typically live 1-2 years, larger counterparts can thrive for decades.


We illustrate how much the highest earning athletes across seven different sports make, and where they get their money from.


See how much the debt-to-GDP ratios of advanced economies have grown (or shrank) since the year 2000.


This graphic shows why brass rods are the secure choice for precision-machined and forged parts.


We detail the admission rates and average annual cost for Ivy League schools, as well as the median SAT scores required to be accepted.


China has grown its nuclear capacity over the last decade, now ranking second on the list of top nuclear energy producers.


The price of gold has set record highs in 2024, but how has this precious metal performed relative to the S&P 500?


