Markets
The Growth of a $1,000 Equity Investment, by Stock Market
![]() See this visualization first on the Voronoi app.
See this visualization first on the Voronoi app.
Visualizing Stock Market Growth by Country
This was originally posted on our Voronoi app. Download the app for free on iOS or Android and discover incredible data-driven charts from a variety of trusted sources.
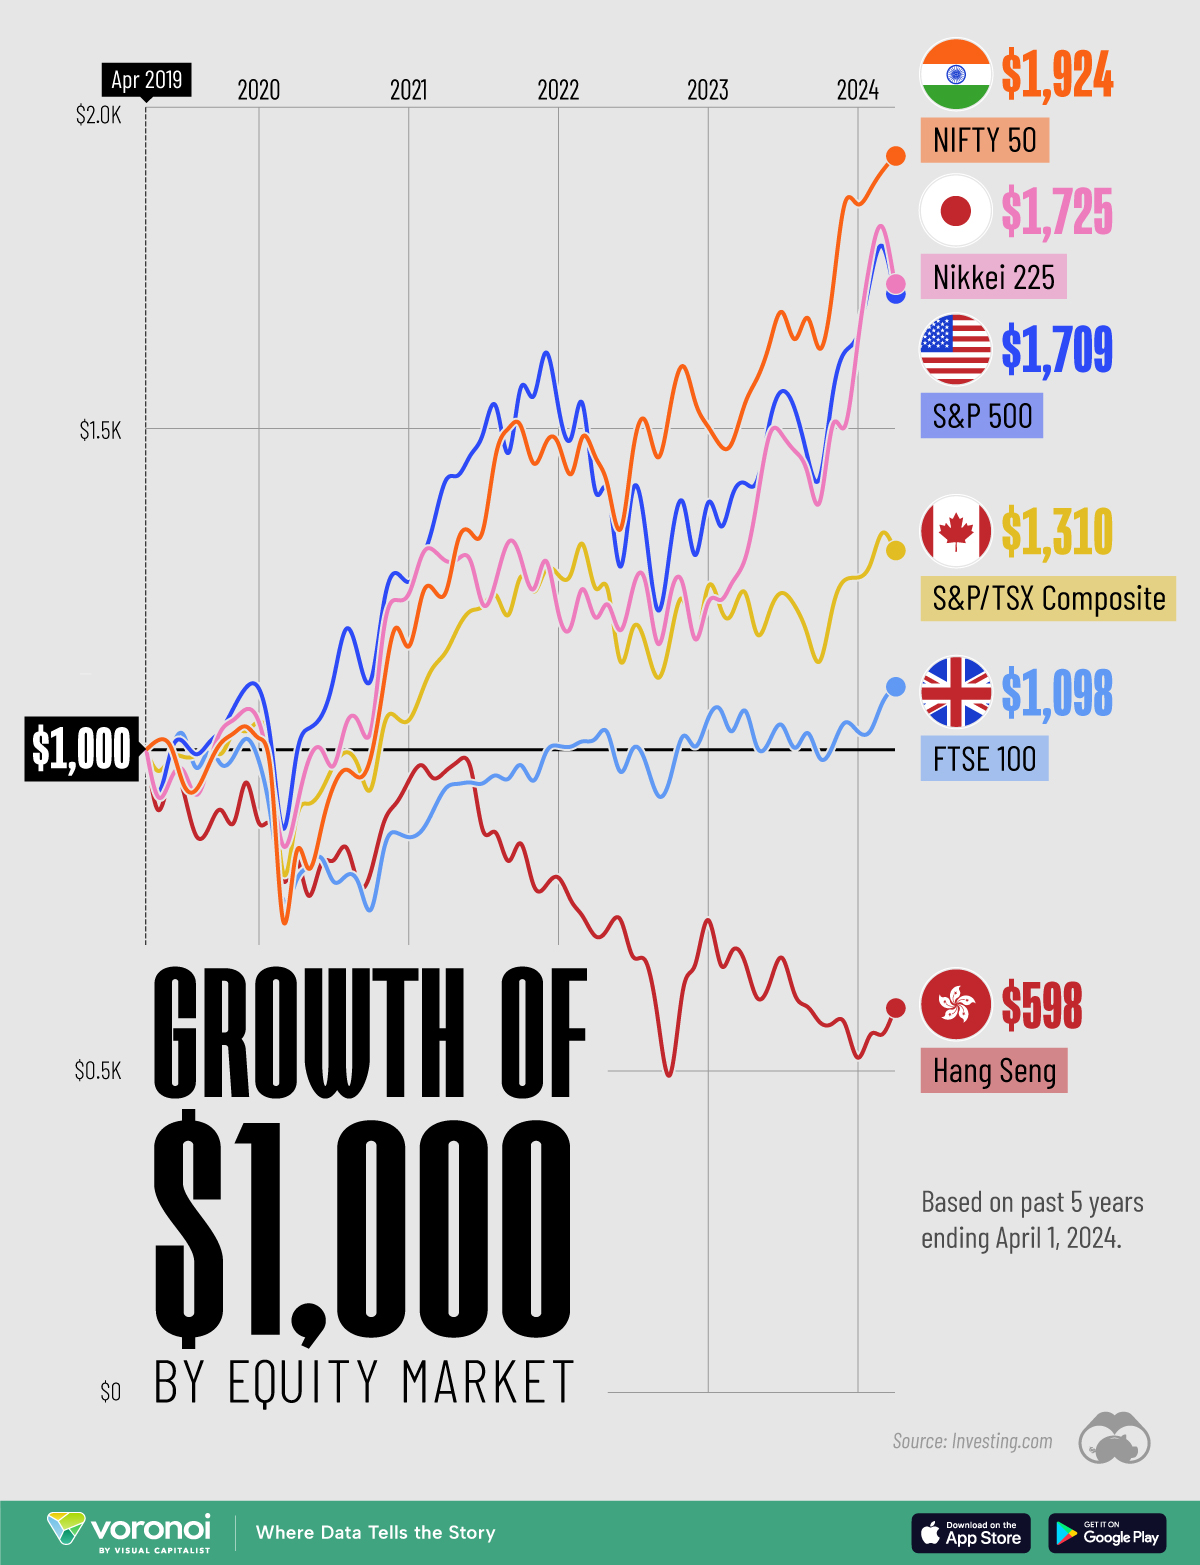
In this graphic, we show the change in value of a $1,000 investment in various leading equity indexes from around the world. This data was sourced from Investing.com, and covers a five-year period from April 2019 to April 2024.
See the following table for the five-year annual return figures of the indexes shown above.
| Index | 5-Yr Return as of April 1, 2024 |
|---|---|
| 🇮🇳 NIFTY 50 | 92.4% |
| 🇯🇵 Nikkei 225 | 72.5% |
| 🇺🇸 S&P 500 | 70.9% |
| 🇨🇦 S&P/TSX Composite | 31.0% |
| 🇬🇧 FTSE 100 | 9.8% |
| 🇭🇰 Hang Seng | -40.2% |
In terms of stock market growth by country, India (represented here by the NIFTY 50) has impressively surpassed both the U.S. and Japan.
What is the NIFTY 50?
The NIFTY 50 is an index of the 50 largest and most actively traded Indian stocks. Similar to the S&P 500, it represents a range of industries and acts as a benchmark for investors to gauge the performance of the country’s broader stock market.
What’s Going on in India?
India’s multi-year bull market has led to several records being shattered in 2023. For example, the country’s total stock market market capitalization surpassed $4 trillion for the first time, while India-focused ETFs pulled in net inflows of $8.6 billion over the year.
A primary driver of this growth is the country’s fast-rising middle class. According to a report by Morgan Stanley, this “once-in-a-generation shift” will result in India having the third largest stock market globally by 2030, presumably behind the U.S. and China.
Japan Also Breaks Records
Japanese equities (represented in this graphic by the Nikkei 225) slightly outperformed the S&P 500 over the past five years. The index, which represents the top 225 companies on the Tokyo Stock Exchange, recently set a new record high for the first time since 1989.
Japanese companies have reported strong earnings as of late, partly thanks to a weak yen, which benefits many of the country’s export-reliant companies.
Learn More About Global Markets From Visual Capitalist
If you enjoyed this graphic, be sure to check out The World’s Biggest Stock Markets, by Country, which provides a unique perspective on country-level market capitalizations.


Maps
Mapped: The 10 U.S. States With the Lowest Real GDP Growth
In this graphic, we show where real GDP lagged the most across America in 2023 as high interest rates weighed on state economies.


The Top 10 U.S. States, by Lowest Real GDP Growth
This was originally posted on our Voronoi app. Download the app for free on iOS or Android and discover incredible data-driven charts from a variety of trusted sources.
While the U.S. economy defied expectations in 2023, posting 2.5% in real GDP growth, several states lagged behind.
Last year, oil-producing states led the pack in terms of real GDP growth across America, while the lowest growth was seen in states that were more sensitive to the impact of high interest rates, particularly due to slowdowns in the manufacturing and finance sectors.
This graphic shows the 10 states with the least robust real GDP growth in 2023, based on data from the Bureau of Economic Analysis.
Weakest State Economies in 2023
Below, we show the states with the slowest economic activity in inflation-adjusted terms, using chained 2017 dollars:
| Rank | State | Real GDP Growth 2023 YoY | Real GDP 2023 |
|---|---|---|---|
| 1 | Delaware | -1.2% | $74B |
| 2 | Wisconsin | +0.2% | $337B |
| 3 | New York | +0.7% | $1.8T |
| 4 | Missississippi | +0.7% | $115B |
| 5 | Georgia | +0.8% | $661B |
| 6 | Minnesota | +1.2% | $384B |
| 7 | New Hampshire | +1.2% | $91B |
| 8 | Ohio | +1.2% | $698B |
| 9 | Iowa | +1.3% | $200B |
| 10 | Illinois | +1.3% | $876B |
| U.S. | +2.5% | $22.4T |
Delaware witnessed the slowest growth in the country, with real GDP growth of -1.2% over the year as a sluggish finance and insurance sector dampened the state’s economy.
Like Delaware, the Midwestern state of Wisconsin also experienced declines across the finance and insurance sector, in addition to steep drops in the agriculture and manufacturing industries.
America’s third-biggest economy, New York, grew just 0.7% in 2023, falling far below the U.S. average. High interest rates took a toll on key sectors, with notable slowdowns in the construction and manufacturing sectors. In addition, falling home prices and a weaker job market contributed to slower economic growth.
Meanwhile, Georgia experienced the fifth-lowest real GDP growth rate. In March 2024, Rivian paused plans to build a $5 billion EV factory in Georgia, which was set to be one of the biggest economic development initiatives in the state in history.
These delays are likely to exacerbate setbacks for the state, however, both Kia and Hyundai have made significant investments in the EV industry, which could help boost Georgia’s manufacturing sector looking ahead.

-

 United States5 days ago
Mapped: Countries Where Recreational Cannabis is Legal
-

 Technology2 weeks ago
Mapped: The Number of AI Startups By Country
-

 Healthcare2 weeks ago
Life Expectancy by Region (1950-2050F)
-

 Markets2 weeks ago
Mapped: Europe’s GDP Per Capita, by Country
-

 Money1 week ago
Charted: What Frustrates Americans About the Tax System
-

 Technology1 week ago
Countries With the Highest Rates of Crypto Ownership
-

 Mining1 week ago
Where the World’s Aluminum is Smelted, by Country
-

 Personal Finance1 week ago
Visualizing the Tax Burden of Every U.S. State