Maps
Mapped: Southeast Asia’s GDP Per Capita, by Country
![]() See this visualization first on the Voronoi app.
See this visualization first on the Voronoi app.
Mapped: Southeast Asia’s GDP Per Capita, by Country
This was originally posted on our Voronoi app. Download the app for free on iOS or Android and discover incredible data-driven charts from a variety of trusted sources.
In 1937, as America navigated the Great Depression, Russian-born economist Simon Kuznets presented a novel idea on measuring a country’s economy. And thus, gross domestic product (GDP) was born.
Nearly eight decades later, measuring GDP, and GDP per capita—which helps make data comparable between populations—has become a benchmark statistic to compare and contrast countries’ economies and productivity.
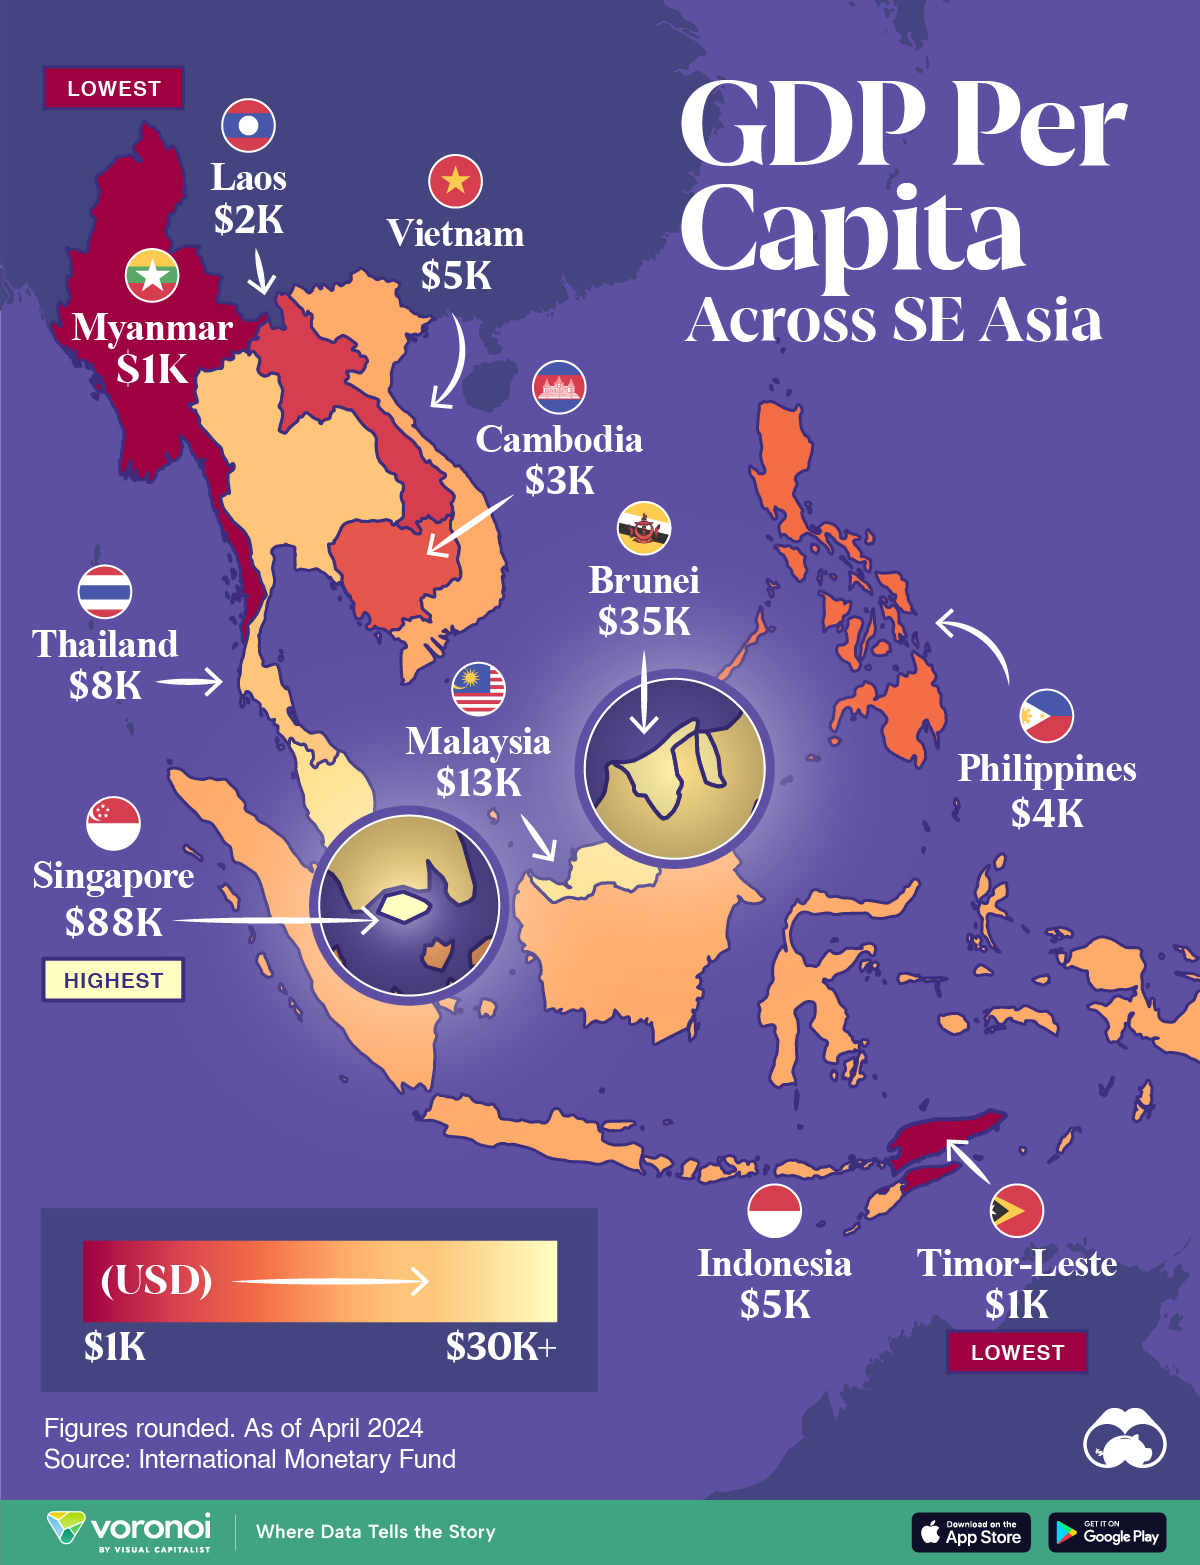
In this map, we compare Southeast Asia’s GDP per capita levels. Data is in current U.S. dollars, sourced from the International Monetary Fund’s DataMapper tool, last updated April 2024.
Ranked: Southeast Asian Countries by GDP Per Capita
Singapore stands head-and-shoulders above the rest of the region with a per capita GDP past $88,000. It is also, incidentally, one of the richest nations in the world by this metric.
The 734 km² country has only 5.6 million residents and very few natural resources. However the country’s strategic location makes it a center for trade and commerce.
| Country | GDP Per Capita |
|---|---|
| 🇸🇬 Singapore | $88,450 |
| 🇧🇳 Brunei | $35,110 |
| 🇲🇾 Malaysia | $13,310 |
| 🇹🇭 Thailand | $7,810 |
| 🇮🇩 Indonesia | $5,270 |
| 🇻🇳 Vietnam | $4,620 |
| 🇵🇭 Philippines | $4,130 |
| 🇰🇭 Cambodia | $2,630 |
| 🇱🇦 Laos | $1,980 |
| 🇹🇱 Timor-Leste | $1,450 |
| 🇲🇲 Myanmar | $1,250 |
Note: Figures are rounded.
This is in sharp contrast to Brunei, Southeast Asia’s next richest country, with a per capita GDP of $35,110.
Oil is a critical part of Brunei’s economy, making it both very wealthy, but landing it in a vulnerable, resource-dependent position. Oil and gas revenues contribute half the country’s entire revenue receipts.
Two countries known for their large tourism sectors, Malaysia and Thailand rank third and fourth, at $13,310 and $7,810 respectively.
Finally, Southeast Asia’s largest economy, and the world’s fourth-most populous country Indonesia, rounds out the top five with a GDP per capita of $5,270.


Maps
Mapped: The 10 U.S. States With the Lowest Real GDP Growth
In this graphic, we show where real GDP lagged the most across America in 2023 as high interest rates weighed on state economies.


The Top 10 U.S. States, by Lowest Real GDP Growth
This was originally posted on our Voronoi app. Download the app for free on iOS or Android and discover incredible data-driven charts from a variety of trusted sources.
While the U.S. economy defied expectations in 2023, posting 2.5% in real GDP growth, several states lagged behind.
Last year, oil-producing states led the pack in terms of real GDP growth across America, while the lowest growth was seen in states that were more sensitive to the impact of high interest rates, particularly due to slowdowns in the manufacturing and finance sectors.
This graphic shows the 10 states with the least robust real GDP growth in 2023, based on data from the Bureau of Economic Analysis.
Weakest State Economies in 2023
Below, we show the states with the slowest economic activity in inflation-adjusted terms, using chained 2017 dollars:
| Rank | State | Real GDP Growth 2023 YoY | Real GDP 2023 |
|---|---|---|---|
| 1 | Delaware | -1.2% | $74B |
| 2 | Wisconsin | +0.2% | $337B |
| 3 | New York | +0.7% | $1.8T |
| 4 | Missississippi | +0.7% | $115B |
| 5 | Georgia | +0.8% | $661B |
| 6 | Minnesota | +1.2% | $384B |
| 7 | New Hampshire | +1.2% | $91B |
| 8 | Ohio | +1.2% | $698B |
| 9 | Iowa | +1.3% | $200B |
| 10 | Illinois | +1.3% | $876B |
| U.S. | +2.5% | $22.4T |
Delaware witnessed the slowest growth in the country, with real GDP growth of -1.2% over the year as a sluggish finance and insurance sector dampened the state’s economy.
Like Delaware, the Midwestern state of Wisconsin also experienced declines across the finance and insurance sector, in addition to steep drops in the agriculture and manufacturing industries.
America’s third-biggest economy, New York, grew just 0.7% in 2023, falling far below the U.S. average. High interest rates took a toll on key sectors, with notable slowdowns in the construction and manufacturing sectors. In addition, falling home prices and a weaker job market contributed to slower economic growth.
Meanwhile, Georgia experienced the fifth-lowest real GDP growth rate. In March 2024, Rivian paused plans to build a $5 billion EV factory in Georgia, which was set to be one of the biggest economic development initiatives in the state in history.
These delays are likely to exacerbate setbacks for the state, however, both Kia and Hyundai have made significant investments in the EV industry, which could help boost Georgia’s manufacturing sector looking ahead.

-

 United States5 days ago
Mapped: Countries Where Recreational Cannabis is Legal
-

 Technology2 weeks ago
Mapped: The Number of AI Startups By Country
-

 Healthcare2 weeks ago
Life Expectancy by Region (1950-2050F)
-

 Markets2 weeks ago
The Growth of a $1,000 Equity Investment, by Stock Market
-

 Markets2 weeks ago
Mapped: Europe’s GDP Per Capita, by Country
-

 Money1 week ago
Charted: What Frustrates Americans About the Tax System
-

 Technology1 week ago
Countries With the Highest Rates of Crypto Ownership
-

 Mining1 week ago
Where the World’s Aluminum is Smelted, by Country