

One country is taking reforestation very seriously, registering more than 400,000 square km of forest growth in two decades.
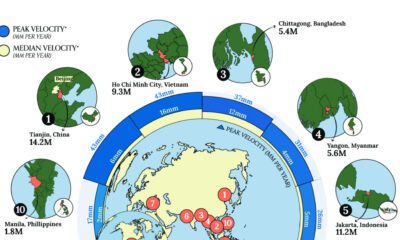

Many major coastal cities are experiencing local land subsidence where underground soil and rock collapse, causing the surface above to sink.
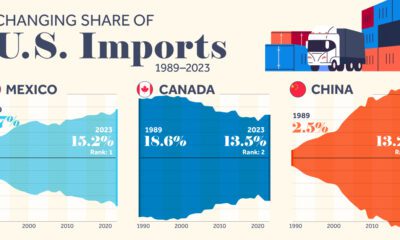

We highlight seven key U.S. trade partners and their changing share in the sources of U.S. imports from 1989–2023.
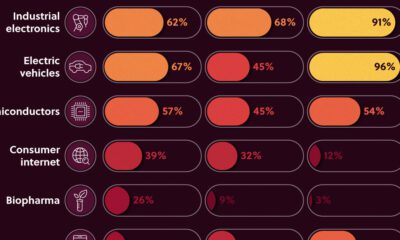

We look at the share of Asian companies in the top 3,000 global firms—measured by market capitalization in 2020—broken down by industry.
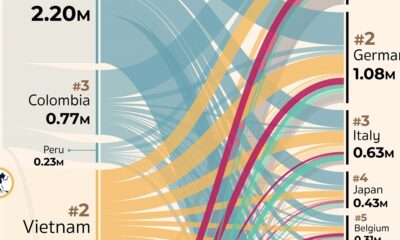

Which countries export, and import, the most coffee? This visual highlights the global coffee trade by export flows in 2019.
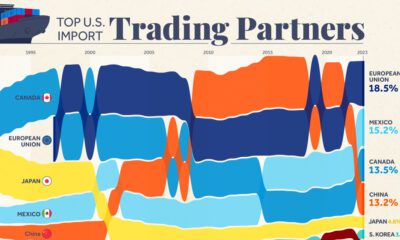

Nearly 60% of U.S. imports came from just four trade entities in 2023. We rank the top U.S. trading partners and show their growth over time.
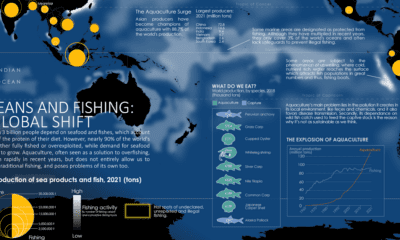

Where do our fish come from? This map charts ocean fishing activity and the amount of fish coming from aquaculture.
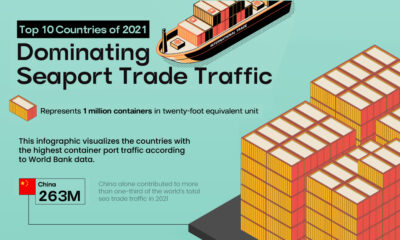

This infographic highlights the countries with the highest container traffic across their ports, thus dominating seaport trade in 2021.
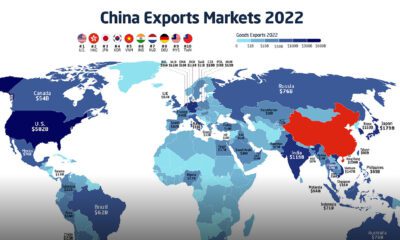

In 2022, China exported $3.6 trillion of goods, more than the GDP of the UK or India. Here's how Chinese exports have evolved since 2001.
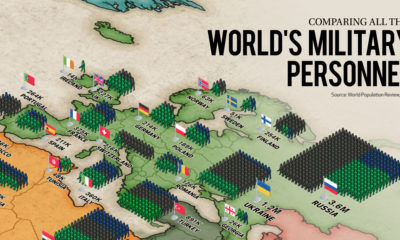

Which countries have the biggest militaries in the world? This map reveals all the world’s military personnel.


 Creator Program