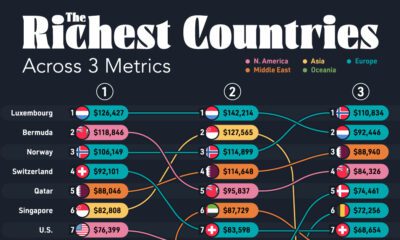

Here's how the world's richest countries stack up by different measures of GDP per capita, including adjusting for PPP and productivity.

What are the world's top countries by GDP per capita? How do those rankings change when we adjust for purchasing power parity?


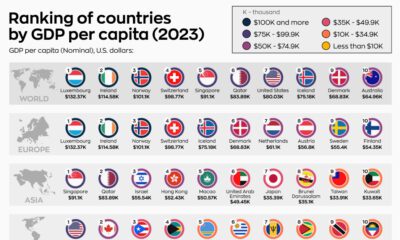
Analyzing 2023 per capita GDP numbers from the International Monetary Fund lets us know where the richest countries in the world are.


Analyzing 2023 per capita GDP numbers from the International Monetary Fund lets us know where the poorest countries are.
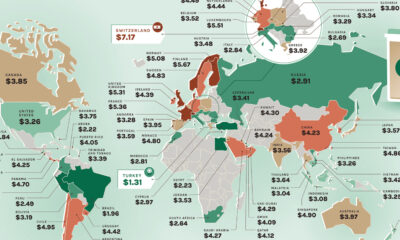

Where would you find the most and least expensive Starbucks coffee? These maps show the price of a Tall Latte in every country.
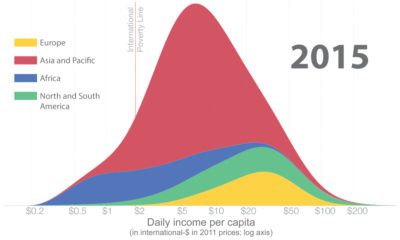

How has global income distribution changed over history? Below, we show three distinct periods since the Industrial Revolution.
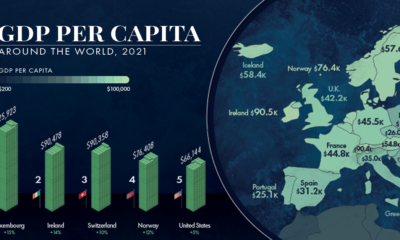

GDP per capita is one of the best measures of a country's standard of living. This map showcases the GDP per capita in every country globally.
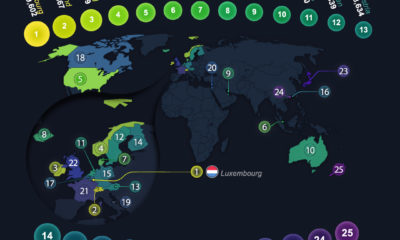

Which countries have the highest GDP per capita? This map breaks down the top 25 richest countries in the world.
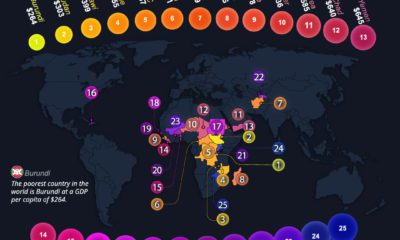

Which countries have the lowest GDP per capita? This map looks at the 25 poorest countries in the world in terms of GDP per capita.
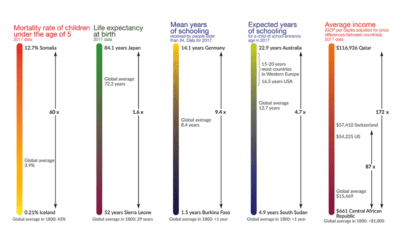

This visualization shows the global inequality gap — a difference in the standards of living around the world, as well as how it's changed over 200...


 Creator Program